Site search:
-
What’s new?
Energy for London Tags
Brent Buildings Camden Carbon Emissions CHP Cities Climate Adaptation Community Heating Community Initiatives Croydon Data DECC Decentralised Energy Distribution ECO Energy Costs Energy Efficiency Enfield FIT Fuel Poverty Funding Green Deal Hackney Haringey Housing Islington Lambeth Library Local Authorities Mayor Newham Ofgem Olympics Photovoltaics Planning RE:FIT RE:NEW Renewable Energy Retrofit Southwark Tower Hamlets Transport Waltham Forest Waste WestminsterEnergy Archives:
- February 2021 (1)
- January 2021 (15)
- December 2020 (15)
- November 2020 (9)
- October 2020 (3)
- August 2020 (5)
- July 2020 (3)
- June 2020 (4)
- April 2020 (10)
- March 2020 (5)
- February 2020 (2)
- January 2020 (3)
- October 2019 (1)
- September 2019 (4)
- August 2019 (2)
- July 2019 (1)
- August 2018 (1)
- November 2016 (8)
- October 2016 (8)
- September 2016 (2)
- August 2016 (8)
- July 2016 (14)
- April 2016 (12)
- March 2016 (16)
- February 2016 (8)
- January 2016 (4)
- December 2015 (1)
- November 2015 (1)
- October 2015 (16)
- September 2015 (3)
- June 2015 (1)
- May 2015 (1)
- April 2015 (1)
- March 2015 (1)
- February 2015 (1)
- January 2015 (1)
- December 2014 (18)
- November 2014 (4)
- August 2014 (8)
- July 2014 (7)
- June 2014 (25)
- May 2014 (8)
- April 2014 (4)
- March 2014 (12)
- February 2014 (7)
- January 2014 (13)
- December 2013 (11)
- November 2013 (15)
- October 2013 (15)
- September 2013 (18)
- August 2013 (5)
- July 2013 (20)
- June 2013 (33)
- May 2013 (8)
- April 2013 (16)
- March 2013 (25)
- February 2013 (14)
- January 2013 (20)
- December 2012 (23)
- November 2012 (23)
- October 2012 (25)
- September 2012 (14)
- July 2012 (12)
- June 2012 (43)
- May 2012 (20)
- April 2012 (8)
- March 2012 (40)
- February 2012 (39)
- January 2012 (40)
- December 2011 (22)
- November 2011 (40)
- October 2011 (33)
- September 2011 (48)
- August 2011 (40)
- July 2011 (58)
- June 2011 (41)
- May 2011 (80)
- April 2011 (38)
- March 2011 (33)
- February 2011 (25)
- January 2011 (24)
- December 2010 (3)
- November 2010 (7)
- October 2010 (6)
- September 2010 (7)
- August 2010 (1)
- July 2010 (2)
- June 2010 (4)
- May 2010 (1)
- March 2010 (3)
- February 2010 (3)
- December 2009 (5)
- November 2009 (2)
- October 2009 (3)
- July 2009 (3)
- June 2009 (1)
- April 2009 (1)
- March 2009 (1)
- February 2009 (1)
- January 2009 (1)
- December 2008 (2)
- October 2008 (1)
- September 2008 (1)
- July 2008 (1)
- March 2008 (2)
- January 2008 (2)
- October 2007 (1)
- September 2007 (3)
- July 2007 (1)
- March 2007 (1)
- February 2007 (3)
- November 2006 (3)
- August 2006 (1)
- February 2006 (1)
- May 2005 (1)
- February 2004 (1)
Data Store
4MW of PV added in London
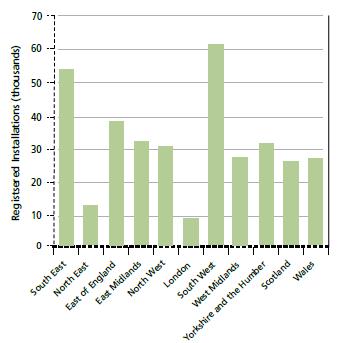
March 2013: Ofgem’s new FIT quarterly report provides an update on the take-up of Feed in Tariff eligible technologies across the UK. London (as at 31 December 2012) has a total of 39.38 MW of FIT renewable capacity installed – as with the rest of the country, the vast proportion of this capacity is made up of PV (99% in London). This is an increase of 4.25 MW of capacity over the previous quarter.
Progress remains slow in London which – with the North East – trails all other UK regions by a significant margin. See graph from FIT report below highlighting the number of installations by region.
 Previous posts discuss London’s slow performance on FIT take up here.
London Ward Profiles
March 2013: Available at London Datastore: “The ward profiles and ward atlas provide a range of demographic and related data for each ward in Greater London. They are designed to provide an overview of the population in these small areas by presenting a range of data on the population, diversity, households, life expectancy, housing, crime, benefits, land use, deprivation, and employment.”
London SME retrofit programme details
15 March 2013: Details have been released that funding has been approved by the Mayor for a energy efficiency programme targeted at London’s small and medium enterprises (SMEs). The approval form sets out that “up to £21,000 will be allocated to commission work to deliver energy efficiency retrofit services. The project seeks to develop SME engagement, improve knowledge of the SME retrofit landscape, and establish suitable financial and delivery models using learning gained from the RE:FIT and RE:NEW programmes, with work to be completed by end-March 2013”.
The Mayor’s 2011 energy strategy set out findings that:
- small and medium enterprises (SMEs) are reluctant to take action on installing energy efficiency measures and low and zero-carbon microgeneration technologies without seeing that government is taking action on it first (see para 2 or research here)
- There are currently over 830,000 SMEs in the capital and collectively SMEs emit 20 per cent of the UK’s total CO2 emissions. Due to their size, SMEs often do not have sufficient resources and expertise to allocate to energy management, and therefore require support and advice to reduce their energy use.
- However, it is also often hard to reach SMEs and much of the support or drivers through legislation and other programmes are geared towards large organisations (SME data can be found here and here)
And set out the following action:
- Action 8.5 – The Mayor will support SMEs to reduce their energy use by working with partners and using his programmes to signpost SMEs to existing sources of energy efficiency support. The Mayor will also review the provision of energy efficiency support to SMEs in London, identifying areas where further action is required, and developing support in areas where the Mayor can contribute to its quality, availability and accessibility.
“This work would directly feed into a paper submitted to the Housing Investment Group for approval of GLA funding and resources to deliver pilot projects in 2013-14, and develop a pan-London SME programme. It is currently anticipated that procurement for the full programme would be commenced from 2014, with a full roll-out from 2015 onwards.”
Hence any pan-London programme would, if approved, fully start under a new Mayor after the next London election.
Electricity Consumption per London Borough
February 2013: London Datastore has posted a cut-down version of DECC’s latest statistics of electricity consumption by local authority providing just the London boroughs detail (use the Excel link provided on the London Datastore webpage). A timeseries of data from 2003-2011 is made available and includes electricity consumption (GWh) per borough for domestic customers and I&C (industrial and commercial) consumers. The table also provides the number of MPANs (Meter Point Administration Number) per borough per domestic/I&C sector. For more on MPANs see the following entry on Wikipedia …and for still more see the following factsheet on Elexon’s website.
New Energy Centre for Energy Epidemiology
January 2013: University College London announced that it has been awarded funding to establish the UCL-Energy Centre for Energy Epidemiology which “will focus on providing an evidence base for government and industry to support end use energy reduction across buildings and transport, helping to deliver the UK’s commitment to reduce greenhouse gas emissions by 80% of 1990 levels by 2050.” ‘Energy Epidemiology – it says here – is apparently “the systematic use of measured data to illuminate the causes of energy use and of changes in energy use. The approach has a long history in health research, but has not so far been applied, at scale, to the study of energy.” So now you know!
London energy data maps
January 2013: Tim Starley Grainger has posted some useful graphics on how London is faring under some key Government energy efficiency and renewable energy programmes, such as CERT, Warm Front and progress under the Feed in Tariffs (FITs). As highlighted in various posts on this site, it doesn’t make for cheerful viewing. Graphics posted here.
The Electric City
December 2012: Following last week’s LSE Cities ‘Electric City’ conference which took place at the fascinating ‘Former Shoreditch Electricity Generating Station & Refuse Destructor’ some material have been posted online.
- A series of essays on the theme Electric City have been brought together in a publication for the conference which can be downloaded here. There’s not much specifically on London’s energy challenges, but the Global Problems: City Solutions contribution highlights an interesting point suggesting that “According to some reports, urban regions already produce ten times more renewable technologies patents than rural regions.”
- A selection of video interviews from the conference are posted on Youtube
- And the Guardian has posted a series of ‘exclusive data visualisations’ from the conference which includes ‘Unpacking London: energy & pollution’ highlighting that “Three quarters of London’s energy consumption is fueled directly by oil and gas, with the vast majority of the remainder generated by fossil-fuel-powered electricity. Just 2.1% comes either direct from waste and renewables or from renewably-generated electricity.”
Waltham Forest has highest number of PV installations of any London borough
 24 October 2012: A recent post provided some regional detail of the uptake of Feed in Tariff (FITs) generators – predominantly photovoltaics (PVs) – across the UK (at the English regions and devolved administrations level). DECC have today released an updated spreadsheet providing a breakdown on the number of installations at local authority and parliamentary constituency level. This highlights that:
- London’s suburbs do the best in relation to PVs installed with Waltham Forest having the highest number of installs of all London boroughs (701); then Bromley (666), Croydon (525) and Havering (440).
- The parliamentary constituency of Walthamstow has accordingly the highest number of PV installations of any constituency in London (373). [For context, Tiverton in Devon has the highest number of installations of any UK constituency – 2,456]
- Unfortunately installed capacity (ie kWe of generation) by local authority/constituency is not available – which would be a more helpful metric (it is included available on a per installation basis in Ofgem’s comprehensive FIT spreadsheet (370k+ entries) – the latest of which was published a few weeks ago – and which Energy for London is currently going through and will report on shortly).
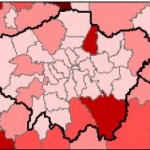
- A not very helpful map is also provided by DECC today of Number of domestic photovoltaic installations by Local Authority, as at end of September 2012
In addition to the direct link here the spreadsheet can also be downloaded from the following DECC FITs webpage (the file is called ‘Sub-regional Feed-in Tariffs confirmed on the CFR statistics‘).
Posted in Data Store, News
Tagged Bromley, Croydon, Data, FIT, Havering, Photovoltaics, Waltham Forest
Leave a comment
Carbon Visualisation
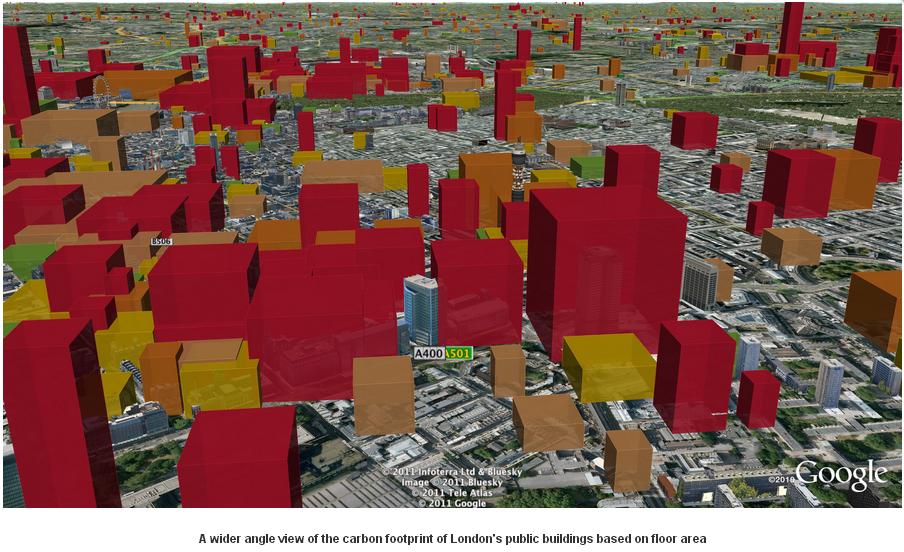
October 2012: A previous post highlighted how a campaign by the excellent Centre for Sustainable Energy managed to secure the release of a 40,000 dataset of public sector buildings Display Energy Certificates (DECs).
CSE have recently highlighted how this data has been used by a company called Carbon Visuals.

Some of the London building carbon data is illustrated above.
Carbon Visuals explain:
“With a grant from the UK’s Technology Strategy Board we have been exploring real-time visualisation and the visualisation of large data-sets. One of the results is an interactive visualisation of the carbon footprint of every public building in England and Wales – 40 thousand of them!
http://uk-energy-ratings.carbonvisuals.com/ The visualisation works in any browser that can run the Google Earth plugin but because the dataset is large, the plugin may perform sluggishly on slow computers. Or open in desktop version of Google Earth: http://uk-energy-ratings.carbonvisuals.com/kml/uk-emissions.kml “
Statistics on new housing starts and completions in each local authority in London
September 2012: Recent parliamentary question in the House of Commons provides a useful summary on where London housing statistics are kept and collated.
Statistics on new housing starts and completions in each local authority in London, taken from the National Statistics on House Building, are published in live table 253 on the Department for Communities and Local Government’s website which is available on the following link.
These statistics show starts and completions split by tenure according to whether the organisation responsible for the development is a private company, a housing association or a local authority. The figures for housing associations and local authorities can together be used as a proxy for affordable housing starts and completions. However, these figures may underestimate affordable housing supply and overestimate private housing, as they are from building control records in which the ultimate tenure may be difficult to identify.
Statistics on the full extent of affordable housing supply by local authority are published in the Department’s live tables 1006, 1007 and 1008, which are available at the following link.
From 1 April 2012, the Mayor of London has had oversight of strategic housing, regeneration and economic development in London.
Greenhouse Gas summary reports
15 June 2012: DECC have issued a series of useful summary documents on greenhouse emissions related to key sectors:
- GHG Inventory summary factsheet: energy supply
- GHG Inventory summary factsheet: public sector
- GHG Inventory summary factsheet: residential
- GHG Inventory summary factsheet: transport
- GHG Inventory summary factsheet: waste
- GHG Inventory summary factsheets – amalgamated document
- Carbon dioxide factsheet
- All gas factsheets as single document
Posted in Data Store
Tagged Carbon Emissions, Data, Housing, Local Authorities, Waste
Leave a comment


