October 2012: A previous post highlighted how a campaign by the excellent Centre for Sustainable Energy managed to secure the release of a 40,000 dataset of public sector buildings Display Energy Certificates (DECs).
CSE have recently highlighted how this data has been used by a company called Carbon Visuals.

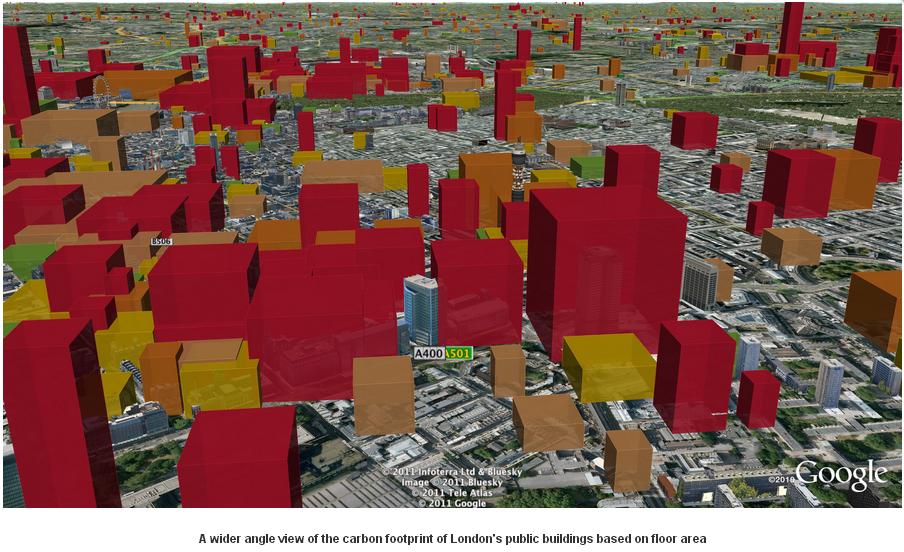
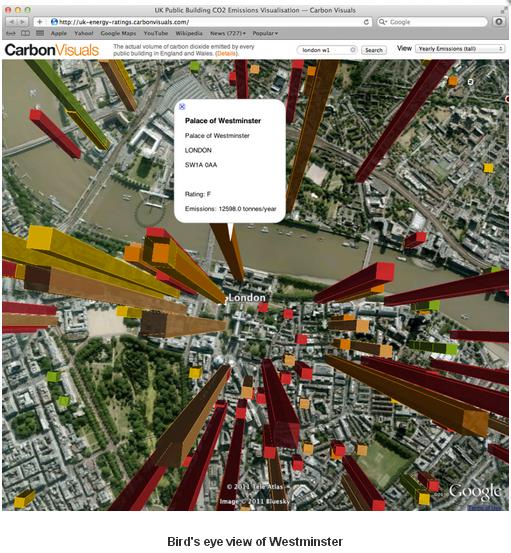
Some of the London building carbon data is illustrated above.
Carbon Visuals explain:
“With a grant from the UK’s Technology Strategy Board we have been exploring real-time visualisation and the visualisation of large data-sets. One of the results is an interactive visualisation of the carbon footprint of every public building in England and Wales – 40 thousand of them!
http://uk-energy-ratings.carbonvisuals.com/ The visualisation works in any browser that can run the Google Earth plugin but because the dataset is large, the plugin may perform sluggishly on slow computers. Or open in desktop version of Google Earth: http://uk-energy-ratings.carbonvisuals.com/kml/uk-emissions.kml “


