
Site search:
-
What’s new?
Energy for London Tags
Brent Buildings Camden Carbon Emissions CHP Cities Climate Adaptation Community Heating Community Initiatives Croydon Data DECC Decentralised Energy Distribution ECO Energy Costs Energy Efficiency Enfield FIT Fuel Poverty Funding Green Deal Hackney Haringey Housing Islington Lambeth Library Local Authorities Mayor Newham Ofgem Olympics Photovoltaics Planning RE:FIT RE:NEW Renewable Energy Retrofit Southwark Tower Hamlets Transport Waltham Forest Waste WestminsterEnergy Archives:
- February 2021 (1)
- January 2021 (15)
- December 2020 (15)
- November 2020 (9)
- October 2020 (3)
- August 2020 (5)
- July 2020 (3)
- June 2020 (4)
- April 2020 (10)
- March 2020 (5)
- February 2020 (2)
- January 2020 (3)
- October 2019 (1)
- September 2019 (4)
- August 2019 (2)
- July 2019 (1)
- August 2018 (1)
- November 2016 (8)
- October 2016 (8)
- September 2016 (2)
- August 2016 (8)
- July 2016 (14)
- April 2016 (12)
- March 2016 (16)
- February 2016 (8)
- January 2016 (4)
- December 2015 (1)
- November 2015 (1)
- October 2015 (16)
- September 2015 (3)
- June 2015 (1)
- May 2015 (1)
- April 2015 (1)
- March 2015 (1)
- February 2015 (1)
- January 2015 (1)
- December 2014 (18)
- November 2014 (4)
- August 2014 (8)
- July 2014 (7)
- June 2014 (25)
- May 2014 (8)
- April 2014 (4)
- March 2014 (12)
- February 2014 (7)
- January 2014 (13)
- December 2013 (11)
- November 2013 (15)
- October 2013 (15)
- September 2013 (18)
- August 2013 (5)
- July 2013 (20)
- June 2013 (33)
- May 2013 (8)
- April 2013 (16)
- March 2013 (25)
- February 2013 (14)
- January 2013 (20)
- December 2012 (23)
- November 2012 (23)
- October 2012 (25)
- September 2012 (14)
- July 2012 (12)
- June 2012 (43)
- May 2012 (20)
- April 2012 (8)
- March 2012 (40)
- February 2012 (39)
- January 2012 (40)
- December 2011 (22)
- November 2011 (40)
- October 2011 (33)
- September 2011 (48)
- August 2011 (40)
- July 2011 (58)
- June 2011 (41)
- May 2011 (80)
- April 2011 (38)
- March 2011 (33)
- February 2011 (25)
- January 2011 (24)
- December 2010 (3)
- November 2010 (7)
- October 2010 (6)
- September 2010 (7)
- August 2010 (1)
- July 2010 (2)
- June 2010 (4)
- May 2010 (1)
- March 2010 (3)
- February 2010 (3)
- December 2009 (5)
- November 2009 (2)
- October 2009 (3)
- July 2009 (3)
- June 2009 (1)
- April 2009 (1)
- March 2009 (1)
- February 2009 (1)
- January 2009 (1)
- December 2008 (2)
- October 2008 (1)
- September 2008 (1)
- July 2008 (1)
- March 2008 (2)
- January 2008 (2)
- October 2007 (1)
- September 2007 (3)
- July 2007 (1)
- March 2007 (1)
- February 2007 (3)
- November 2006 (3)
- August 2006 (1)
- February 2006 (1)
- May 2005 (1)
- February 2004 (1)
Tag Archives: Data
82% of Londoners are concerned about climate change
19 November 2020: London Councils have published the results of a survey to to gauge Londoners’ understanding of climate change and the effect it has on their lives. The poll findings were launched at London Climate Action Week (14 – 20 November) and follow the adoption of net zero emission targets for the majority of London boroughs.
Some headline results below:
- 82% of Londoners are concerned about climate change, with 40% describing themselves as very concerned.
- 57% of Londoners say their level of concern has increased in the last 12 months
- Climate denial is close to non-existent. 2% of Londoners don’t believe in climate change.
- 87% of Londoners are motivated to help prevent climate change
- 59% of Londoners said climate change affects their decision making
- Almost half of Londoners (46%) consider the climate when making day-to-day purchases
Some really interesting results and should give pause for thoughts for many organisations, from local authorities to the private sector, in their decision-making processes. Much more info in the news release on the London Councils website.
Posted in Data Store, News
Tagged Data
Comments Off on 82% of Londoners are concerned about climate change
Latest London PV statistics
August 2016: The last set of sub regional Feed in Tariff (FIT) statistics published by DECC – before it is merged with the business department into BEIS – were published last week (available here). London PV data – alongside other UK regions – is reproduced below.
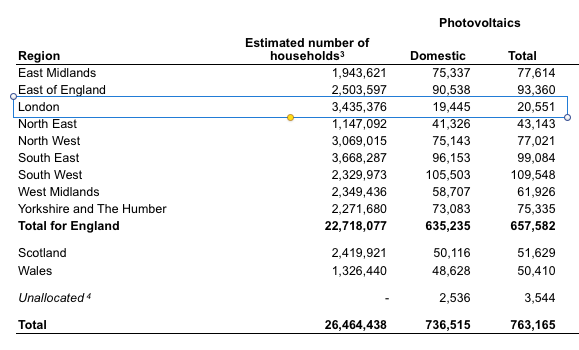
Table 1. Cumulative installations confirmed on the Central Feed-in Tariff Register by Region
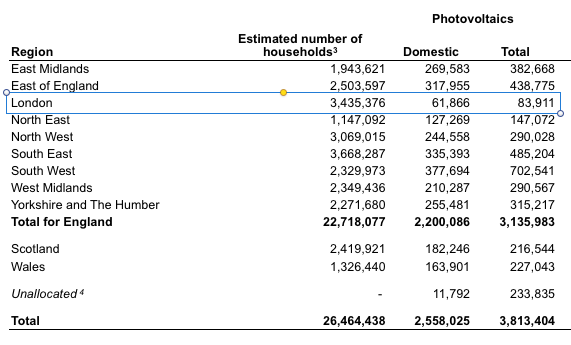
Table 2. Cumulative capacity confirmed on the Central Feed-in Tariff Register by Region
So – as at the end of June 2016:
- London had 20,551 PV installations (95% of which were domestic installations) with a total combined electrical generating capacity of 83.911MW.
- London’s capacity represented just 2% of total UK PV generating capacity
- The last FIT quarterly data set (for data up to the end of March 2016) reported that London had 20,123 PV installations in London and 81.623 MW – indicating a 2.28MW increase in capacity over the last three months.
Overview of CHP data
July 2014: CHP schemes – depending on size and fuel type – can benefit from a variety of government support mechanisms. These mostly take the form of partial exemptions from the Climate Change Levy, the Carbon Reduction Commitment (CRC), Carbon Floor Price, EU Emissions Trading Scheme, and business rates. Interaction with these mechanisms can be pretty complex at times (an overview of these are provided in the following presentations from an industry workshop last December) but critical to attaining these benefits is for the CHP scheme to achieve a ‘Good Quality’ status under the government’s CHPQA programme.
The CHPQA Standard highlights that the QA system has been place since around April 2001 providing “a methodology for assessing the quality of CHP Schemes in terms of their energy efficiency and environmental performance. This methodology is based on Threshold Criteria, which must be met or exceeded in order for the whole of the Scheme to qualify as ‘Good Quality’.” The QA programme also requires an annual submission from each CHP plant wishing to be classed as ‘Good Quality’ – and details on how to comply with this QA standard are set out in some comprehensive guidance notes posted on DECC’s CHPQA microsite here.
The CHPQA admits that “achieving CHPQA Certification may at first glance appear daunting” but fortunately, for the majority of schemes going forward in London (ie smaller scale), can access a more streamlined QA process which is available for <2MWe CHP plant (see guidance note 13). Overall, CHP schemes can be seen to go through some of the most rigorous monitoring requirements of all sustainable energy measures to receive government support.
CHP schemes in London that have achieved the CHPQA standard – and which have given consent for their details to be released – are listed on DECC’s Public CHP database here (set ‘region’ criteria to London). Aggregate CHP statistics are published in DECC’s Digest of UK Energy Statistics and regional (including London) data in the September issue of DECC’s Energy Trends journal. Further data can also be accessed on Ofgem’s CCL CHP register here. Additional detail on CHP and district heating schemes can be found on the London Heat Map.
Energy & Climate Questions to the Mayor
November 2013: This month the Mayor has been asked questions in relation to:
the price of Londoner’s gas bills; the uptake of the Green Deal in London; details of schools going through the RE:FIT Energy Efficiency Programme; the recent GLA-commissioned study looking at London’s Zero Carbon Energy Resource; London Energy Costs; the London Energy Efficiency Fund (LEEF) Loan to Croydon; work undertaken on Energy Efficiency guidance to SMEs; buildings adopting the GLA Sustainable Design and Construction Standards; whether the Mayor had sent a copy of the GLA’s ‘Energy Planning: Monitoring the implementation of London Plan energy policies in 2012‘ research to CLG; the Mayor’s response to a recent Environment Audit Committee recommendation that local authorities should have a statutory duty to produce low-carbon plans for their area; the GLA’s response to CLG’s Allowable Solutions consultation; Mayoral concern over CLG’s Housing Standards Review consultation; organisations working alongside the Mayor’s Affordable Warmth and Health Action Plan; events proposed around the Mayor’s Affordable Warmth and Health Action Plan; London’s children and fuel poverty; evaluation of the Know Your Rights Campaign; the Mayor’s support for nuclear; the Mayor’s response to former PM John Major’s comments on households having to choose between heating or eating; an update report on the Mayor’s Climate Change Mitigation and Energy Strategy; the Mayor’s response to concerns that the ECO is to be scrapped; the Mayor’s strategy for delivering the ECO and Green Deal in London; whether the Mayor has been in contact with CLG over the Housing Standards Review consultation.
Previous months questions to the Mayor can be found here.
Posted in News
Tagged Carbon Emissions, Data, ECO, Fuel Poverty, Funding, Green Deal, Housing, Planning
Leave a comment
Barking & Dagenham most energy efficient local authority in UK
November 2013: A news release from Imperial College highlights a recent study examining the energy consumption of all 198 urban local authorities in the UK, including 33 boroughs in London. Dr James Keirstead has developed a “new method that draws on three different measures of energy efficiency, currently used by city planners, to create the ranking. The aim was to find the fairest methodology for determining energy efficiency that could give planners an improved way of spotting best practice, leading to more energy efficient and sustainable policies in the future.”
“The London boroughs of Barking and Dagenham and Hackney topped the league table of all UK urban areas analysed in the study…This may be because both are low income areas, equating to lower energy usage. Residents of those areas are also more reliant on public transport and these boroughs lack energy-intensive manufacturing and commerce, which may also be other factors that explain why consumption is lower.”
The news report is a very short summary of a detailed research paper published by Dr Keirstead in technical journal Energy Policy (which unfortunately has a price tag associated with downloading the paper). The table from the paper providing a ranking of UK local authorities by average energy efficiency score is reproduced below:

Other London boroughs within the top 10 are Hackney, Merton, Redbridge and Kingston. Oddly, the top two ranked London councils are both within inner London, however, the remaining three in the 10 are all suburban local authorities.
Local authorities in England have now reported to Government on energy efficiency activities in their area in HECA update reports – for more of which, see here.
Posted in Energy Efficiency, News
Tagged Barking and Dagenham, Data, Energy Efficiency, Hackney, HECA, Kingston, Local Authorities, Merton, Redbridge
Leave a comment
Rundown on CHP in London
October 2013: Two recent sources issued by DECC provide data on the use uf Combined Heat and Power (CHP) plant in London. A useful article in DECC’s latest issue of Energy Trends provides a breakdown of CHP use in the regions, providing number of schemes, output, capacity installed and much more. Table 2 from the article is reproduced below.

The data shows a significant increase in the number of CHP schemes operating in London over the past two years (147 – 255) – a 73% jump – whilst generation capacity has grown by 29MW, reflecting the typically smaller scale nature (ie <1MWe) of CHP engines being installed in the capital. Of concern however is that Table 2B (below) from the article reveals that, though the capacity level of CHP has increased – the key metric – the output of decentralised lower-carbon heat and power in London – has actually fallen over the past two years. CHP electricity generation has fallen by 1% and heat generation by 2% in 2012 as compared to 2010 numbers. More promisingly however, the statistics indicate that the 2012 levels show a recovery a far steeper decline in output over the period 2010 to 2011 – so hopefully CHP is now ‘on the up’… Continue reading…
Latest greenhouse gas inventory data for London published
September 2013: The London Datastore has recently posted detailed greenhouse gas emission data for London across a wide range of economic sectors. The spreadsheet for the 2011 update to the London Energy and Greenhouse Gas Inventory (LEGGI) provides estimates of energy consumption and CO2 emissions from Homes, Workplaces and Transport within the Greater London area and is produced by the GLA on an annual basis to measure progress against the Mayor’s Climate Change Mitigation and Energy Strategy.
The Department of Energy and Climate Change (DECC) also provide London emissions data (though not to the level of detail as that set out in the LEGGI) in a series of sub-regional statistics which can be downloaded here.
London Ward Profiles
March 2013: Available at London Datastore: “The ward profiles and ward atlas provide a range of demographic and related data for each ward in Greater London. They are designed to provide an overview of the population in these small areas by presenting a range of data on the population, diversity, households, life expectancy, housing, crime, benefits, land use, deprivation, and employment.”
Regional Green Deal statistics available …but not quite yet
14 March 2013: DECC published their first statistical release today on activity under the Green Deal over the months of January and February 2013 (statement by Secretary of State here). This revealed that 1,803 assessments of properties have taken place over the two months. The statistics however do not set out where these assessments were undertaken – ie no regional breakdown has been provided – which is hugely disappointing. Hence – the following twitter conversation took place.

So – Green Deal (and ECO also …?) regional statistics (hopefully at the local authority rather simply the regional level) will be made available in the fuller dataset released in June of this year. DECC should also consider reporting on a regional basis in the monthly stats …a discussion that will likely continue. Interested parties do feel free to contact DECC to request this happens!
Electricity Consumption per London Borough
February 2013: London Datastore has posted a cut-down version of DECC’s latest statistics of electricity consumption by local authority providing just the London boroughs detail (use the Excel link provided on the London Datastore webpage). A timeseries of data from 2003-2011 is made available and includes electricity consumption (GWh) per borough for domestic customers and I&C (industrial and commercial) consumers. The table also provides the number of MPANs (Meter Point Administration Number) per borough per domestic/I&C sector. For more on MPANs see the following entry on Wikipedia …and for still more see the following factsheet on Elexon’s website.
New Energy Centre for Energy Epidemiology
January 2013: University College London announced that it has been awarded funding to establish the UCL-Energy Centre for Energy Epidemiology which “will focus on providing an evidence base for government and industry to support end use energy reduction across buildings and transport, helping to deliver the UK’s commitment to reduce greenhouse gas emissions by 80% of 1990 levels by 2050.” ‘Energy Epidemiology – it says here – is apparently “the systematic use of measured data to illuminate the causes of energy use and of changes in energy use. The approach has a long history in health research, but has not so far been applied, at scale, to the study of energy.” So now you know!