Site search:
-
What’s new?
Energy for London Tags
Brent Buildings Camden Carbon Emissions CHP Cities Climate Adaptation Community Heating Community Initiatives Croydon Data DECC Decentralised Energy Distribution ECO Energy Costs Energy Efficiency Enfield FIT Fuel Poverty Funding Green Deal Hackney Haringey Housing Islington Lambeth Library Local Authorities Mayor Newham Ofgem Olympics Photovoltaics Planning RE:FIT RE:NEW Renewable Energy Retrofit Southwark Tower Hamlets Transport Waltham Forest Waste WestminsterEnergy Archives:
- February 2021 (1)
- January 2021 (15)
- December 2020 (15)
- November 2020 (9)
- October 2020 (3)
- August 2020 (5)
- July 2020 (3)
- June 2020 (4)
- April 2020 (10)
- March 2020 (5)
- February 2020 (2)
- January 2020 (3)
- October 2019 (1)
- September 2019 (4)
- August 2019 (2)
- July 2019 (1)
- August 2018 (1)
- November 2016 (8)
- October 2016 (8)
- September 2016 (2)
- August 2016 (8)
- July 2016 (14)
- April 2016 (12)
- March 2016 (16)
- February 2016 (8)
- January 2016 (4)
- December 2015 (1)
- November 2015 (1)
- October 2015 (16)
- September 2015 (3)
- June 2015 (1)
- May 2015 (1)
- April 2015 (1)
- March 2015 (1)
- February 2015 (1)
- January 2015 (1)
- December 2014 (18)
- November 2014 (4)
- August 2014 (8)
- July 2014 (7)
- June 2014 (25)
- May 2014 (8)
- April 2014 (4)
- March 2014 (12)
- February 2014 (7)
- January 2014 (13)
- December 2013 (11)
- November 2013 (15)
- October 2013 (15)
- September 2013 (18)
- August 2013 (5)
- July 2013 (20)
- June 2013 (33)
- May 2013 (8)
- April 2013 (16)
- March 2013 (25)
- February 2013 (14)
- January 2013 (20)
- December 2012 (23)
- November 2012 (23)
- October 2012 (25)
- September 2012 (14)
- July 2012 (12)
- June 2012 (43)
- May 2012 (20)
- April 2012 (8)
- March 2012 (40)
- February 2012 (39)
- January 2012 (40)
- December 2011 (22)
- November 2011 (40)
- October 2011 (33)
- September 2011 (48)
- August 2011 (40)
- July 2011 (58)
- June 2011 (41)
- May 2011 (80)
- April 2011 (38)
- March 2011 (33)
- February 2011 (25)
- January 2011 (24)
- December 2010 (3)
- November 2010 (7)
- October 2010 (6)
- September 2010 (7)
- August 2010 (1)
- July 2010 (2)
- June 2010 (4)
- May 2010 (1)
- March 2010 (3)
- February 2010 (3)
- December 2009 (5)
- November 2009 (2)
- October 2009 (3)
- July 2009 (3)
- June 2009 (1)
- April 2009 (1)
- March 2009 (1)
- February 2009 (1)
- January 2009 (1)
- December 2008 (2)
- October 2008 (1)
- September 2008 (1)
- July 2008 (1)
- March 2008 (2)
- January 2008 (2)
- October 2007 (1)
- September 2007 (3)
- July 2007 (1)
- March 2007 (1)
- February 2007 (3)
- November 2006 (3)
- August 2006 (1)
- February 2006 (1)
- May 2005 (1)
- February 2004 (1)
Data Store
Mass-retrofitting of a low carbon zone
June 2012 A very detailed piece of analysis undertaken by researchers at Edinburgh University (and published in the June issue of academic journal Energy Policy) which studies the work being undertaken in Sutton on adopting an area wide retrofit scheme in Hackbridge.
The conclusions highlight some really interesting findings relating to Hackbridge which are also very relevant to other areas of London. These include:
- housing built pre-1918 on average consumes 56% more energy and emits 41% more CO2 than houses built post-2001;
- the older housing stock is the worst performer in terms of energy efficiency; the most laborious and costly to improve;
- within the regeneration footprint, this type of housing makes up less than 20% of the housing stock. Nearly 40% of the housing stock having been built post-1970 is already benefitting from many of the measures proposed to save energy and reduce carbon emissions;
- almost one third of Hackbridge residents live in areas which rank within the top 25% most income-deprived in England, renting their homes from the Local Authority, Registered Social Landlords, Housing Associations or the private-rented sector. Homes in the social-rented sector that have been shown to consume less energy and to emit less CO2 than other housing types of a similar age in Hackbridge. Indeed, using the Government’s Standard Assessment Procedure for the energy rating of dwellings (SAP), the local authority housing in question is shown to out-perform the national average ratings across all dwelling types.
The study also includes: “…while policy analysis over the past decade has done much to highlight the potential contribution mass retrofits in the housing sector can make to reduce the rates of energy consumption and levels of carbon emissions, they also serve to illustrate how little is currently known about the institutional arrangements towns and cities are currently putting in place as integrated solutions to the problems climate change pose.“
Unusually for Energy Policy, the article full downloadable free of charge here.
Use of GIS to determine domestic energy efficiency potential
June 2012: Presentation by the Energy Saving Trust (EST) on helping overcome what EST say is the “disconnect between data managers and delivery teams when delivering retrofit schemes.”
Heat Maps produced for every London borough
June 2012: The London Heat Map project has now posted online heat map reports and datasets for every London borough. Information provided sets out that “The new heat maps are higher resolution with real heat consumption data for priority buildings such as hospitals, leisure centres and local authority buildings. As part of this work, each of the boroughs has developed implementation plans to help them take the decentralised energy opportunities identified to the next stages. The implementation plans include barriers and opportunities, actions to be taken by the council, key dates, personnel responsible.”
Posted in Data Store, News
Tagged CHP, Community Heating, Data, Heat Maps, London Heat Map
Leave a comment
Map of London District Heating Schemes
 June 2012: The London Heat Map captures a lot of the data related to Combined Heat and Power (CHP) and district heating schemes operating in the capital, but the CHPA have added a welcome web resource – a map of UK district heating schemes which includes a good number of London schemes. DECC also provides a list of CHP schemes operating in London – it’s not comprehensive however as operators are not required to have their details listed. Hence, only 32 schemes are listed on the DECC Public CHP database of the 188 schemes DECC state are operating in London in their latest regional CHP statistics.
Posted in Data Store, News
Tagged CHP, Community Heating, Data, Decentralised Energy
Leave a comment
Climate Change Mitigation and Energy Strategy Model Data
June 2012: The London Datastore has recently posted a spreadsheet containing the data behind the Mayor’s climate change mitigation and energy strategy, which was published in October 2011. This is particularly useful as the strategy provided graphical projections of the predicted savings of the Mayor’s various carbon-reduction programmes, but not ‘hard numbers’. Tab 6b of the spreadsheet sets these out, and some of the key programmes are summarised below:
Emissions Savings [MtCO2/yr] of committed Mayoral actions:
| 2010 | 2011 | 2012 | 2013 | 2014 | |
| RE:NEW | 0.0103 | 0.0207 | 0.0310 | 0.2300 | 0.4290 |
| Low Carbon Zones | 0.0009 | 0.0036 | 0.0061 | 0.0061 | 0.0061 |
| New Build through planning (domestic) | 0.1501 | 0.1501 | 0.1501 | 0.0869 | 0.0869 |
| RE:FIT | 0.0012 | 0.0061 | 0.0133 | 0.0217 | 0.0303 |
| Better Buildings Partnership | 0.0000 | 0.0050 | 0.0050 | 0.0050 | 0.0050 |
| ERDF* | 0.0053 | 0.0089 | 0.0089 | 0.0089 | 0.0089 |
| LDA Energy Efficiency Revolving Fund | 0.0000 | 0.0000 | 0.0004 | 0.0004 | 0.0004 |
| New Build through Planning (non-domestic) | 0.2042 | 0.2042 | 0.2042 | 0.1182 | 0.1182 |
*ERDF refers to the funding received by London government through the European Regional Development Fund, which helps fund – amongst other things – the London Green Fund. Further information here.
The Mayor has not as yet reported on savings achieved by his programmes (ie for the years 2010/11 and 2011/12) but Chapter 10 of the Mayor’s energy strategy sets out that these will forthcoming through two actions:
• Action 17.1 – The Mayor will continue to publish the London Energy and Greenhouse Gas Inventory (LEGGI) online every year (the latest dataset is for 2008, published in September 2010)
• Action 17.2 – The Mayor will produce an annual report on London’s progress on meeting its CO2 emissions reduction targets, including annual estimated CO2 emissions, and progress on Mayoral climate change mitigation programmes.
Posted in Data Store, News
Leave a comment
Free London Mapping Tool
May 2012: From the London Datastore website:
‘Have you ever wanted to create a quick thematic map of London but lacked the GIS skills or software to do it yourself?
There is a free mapping tool from the GLA Intelligence Unit that allows the user to input their own borough data to create an instant map that can be copied over into Word or another application of their choice. More information and the tool itself can be found here.’
Renewable Heat Grant Statistics
19 April 2012: The Government’s Renewable Heat Premium Payment (RHPP) scheme operates for a limited period prior to the introduction of the Renewable Heat Incentive (RHI) – and provides money to householders to help buy renewable heating technologies – solar thermal panels, heat pumps and biomass boilers.
For solar thermal products, any householder in England, Scotland and Wales can apply – hence the grants are applicable to Londoners. However, for ground to water, air to water or water to water heat pumps, and for biomass boilers, householders without gas central heating in England, Scotland and Wales can apply (in other words those who are not connected to the gas grid and currently rely on fuels such as oil, liquid gas, solid fuel or electricity for their heating).
The Energy Saving Trust (EST) manages the scheme and have just produced statistics showing the installation of Renewable Heat Premium Payment technologies by region. A total of 74 installations were installed in London out of a total of 5,369 installations across England, Scotland and Wales (just over 1%). The breakdown in London is as follows:
- Air Source Heat Pump – 21
- Ground or Water Source Heat Pump – 2
- Solar Thermal – 51
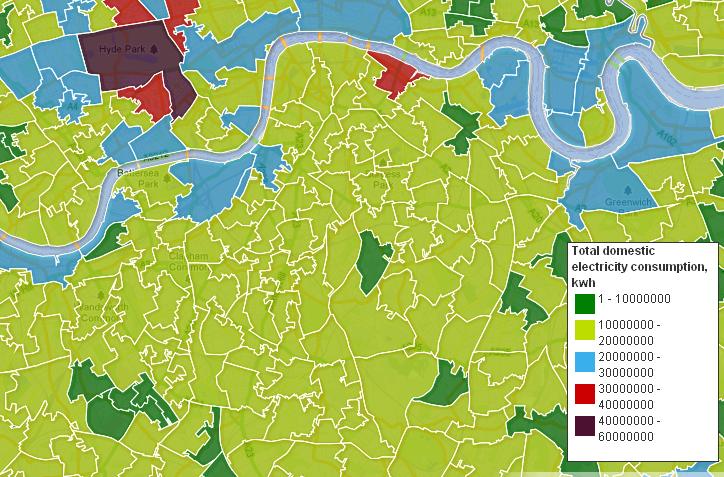
Domestic Electricity use map of Britain
2 April 2012: The Guardian has utilised the data released by DECC last week to produce this map of domestic electricity consumption across the UK.
The map can be accessed on the Guardian’s datablog website
Hills Fuel Data for London
March 2012: The Hills Fuel Poverty report does provide a regional breakdown of data – as the interim did also – and highlights that:
“Table3.9 shows that London households are only slightly less likely to be fuel poor than others, although they do appear to be less deeply in fuel poverty on average, with a considerably lower average fuel poverty gap than other regions. There is a relatively even split between the broad regions in terms ofthe fuel poverty gap, so that region by itself would not be an effective targeting tool.”
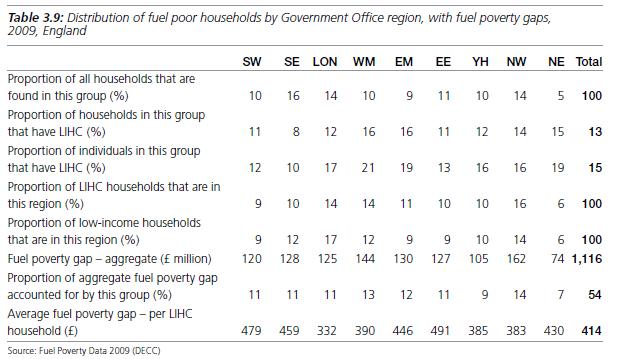 Further details on the report with links provided on an earlier post.
New definition will push up the incidence of fuel poverty in London
 March 2012: The final report from Prof. John Hills has just been published, which provides a series of recommendations to Government in relation to amending the current definition of fuel poverty. The detail behind this study has been covered in some previous posts (see here) but a key output is to recommend that “Government should measure incomes for fuel poverty purposes after housing costs and adjusted for household size and composition.” As a result, the report’s revised indicator (to replace the Government’s current fuel poverty definition) – the LIHC (Low Income High Costs) – “finds that London households account for a greater proportion of fuel poor households than the official indicator.”
The report is vitally important to the debate on how we define future policies to tackle fuel poverty, and will have impacts on framing of the forthcoming Energy Company Obligation (ECO) and the Green Deal.
Links to the report and supplementary material follow below:
- Final report of the Fuel Poverty Review by John Hills – Getting the measure of fuel poverty and also the
- Hills Review Final Report Press Notice
- DECC’s press notice
- Getting the measure of fuel poverty: summary and recommendations
- Data used to produce charts for the final report of the Fuel Poverty Review (Excel file)
- Professor Hills’ presentation on the final report: Getting the measure of fuel poverty (Powerpoint – 5MB)
Low levels of FIT activity in London
March 2012: Energy regulator Ofgem have just issued their latest quarterly report on the progress of Feed in Tariff (FIT) installations across the UK, providing details up to the end of 2011. As reported in a previous post, the last few months of 2011 has seen tremendous activity in relation to photovoltaics, due to the reduction in the support tariff levels from Government. The newsletter highlights that as at 31 December 2011, a total of 147,112 renewable installations have been registered under the scheme since 1 April 2010 (when the scheme started) of which, more than 65,000 installations were registered within the last three months.
Continuing from previous quarters, Ofgem report that photovoltaic (PV) installations continue to represent the vast majority of newly registered installations at over 99 percent of all installations registered between 1 October and 31 December 2011.
Ofgem fortunately also provides a regional breakdown of installations, which highlights a disappointing level of activity in London. In terms of the number of FIT installations, London appears to come at the bottom – just equal or below to the North East – with around 4,000 installations – significantly below all other regions (apart from the North East) – and only 1/6th as much as the best performing region. This number of installations in London represents less than 3% of the total as at December 2011.
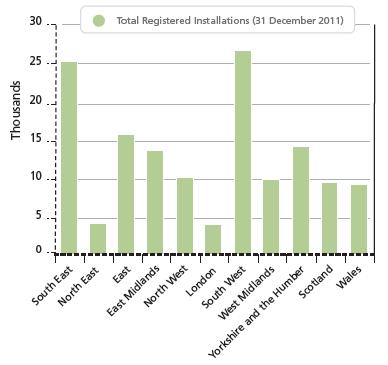 Ofgem also helpfully provide the following regional generation capacity breakdown:
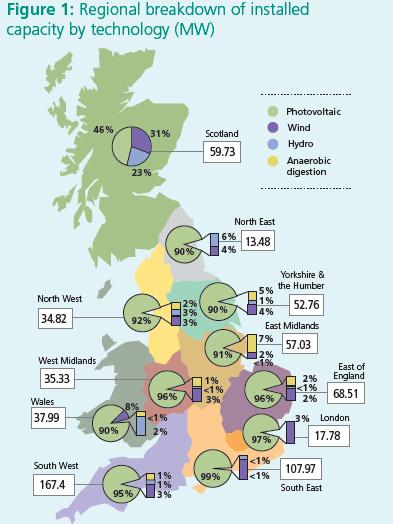 Of the total 661.07MW of of generation capacity registered under the FITs scheme since 1 April 2010, London has the second lowest level of installed capacity at 17.78MW – just 2.7% of the total (only the North East is lower – a region which does after all have lower levels of insolation).
No analysis has been undertaken as yet to why some regions have been more successful than others, or what have been the key factors to the uptake of PVs. London certainly seems to have an active number of solar companies working within the capital and would have significant roof space, both domestic and non-domestic, that would be suitable for the installation of PVs. The high density of rented accommodation (as opposed to owner-occupiers) in London and typically higher costs associated with scaffolding may have been contributing factors. However, it is unlikely that they are the key determining factors in relation to identifying London’s poor performance.
Households treated under Warm Front in London Constituencies
February 2012: DECC have provided a spreadsheet showing the number of households assisted in each parliamentary constituency under the Government’s Warm Front scheme, for the years 2005/06 to 2011/12. The full list for English constituencies can be downloaded here. The spreadsheet filtered for London data can be downloaded here.


