
Site search:
-
What’s new?
Energy for London Tags
Brent Buildings Camden Carbon Emissions CHP Cities Climate Adaptation Community Heating Community Initiatives Croydon Data DECC Decentralised Energy Distribution ECO Energy Costs Energy Efficiency Enfield FIT Fuel Poverty Funding Green Deal Hackney Haringey Housing Islington Lambeth Library Local Authorities Mayor Newham Ofgem Olympics Photovoltaics Planning RE:FIT RE:NEW Renewable Energy Retrofit Southwark Tower Hamlets Transport Waltham Forest Waste WestminsterEnergy Archives:
- February 2021 (1)
- January 2021 (15)
- December 2020 (15)
- November 2020 (9)
- October 2020 (3)
- August 2020 (5)
- July 2020 (3)
- June 2020 (4)
- April 2020 (10)
- March 2020 (5)
- February 2020 (2)
- January 2020 (3)
- October 2019 (1)
- September 2019 (4)
- August 2019 (2)
- July 2019 (1)
- August 2018 (1)
- November 2016 (8)
- October 2016 (8)
- September 2016 (2)
- August 2016 (8)
- July 2016 (14)
- April 2016 (12)
- March 2016 (16)
- February 2016 (8)
- January 2016 (4)
- December 2015 (1)
- November 2015 (1)
- October 2015 (16)
- September 2015 (3)
- June 2015 (1)
- May 2015 (1)
- April 2015 (1)
- March 2015 (1)
- February 2015 (1)
- January 2015 (1)
- December 2014 (18)
- November 2014 (4)
- August 2014 (8)
- July 2014 (7)
- June 2014 (25)
- May 2014 (8)
- April 2014 (4)
- March 2014 (12)
- February 2014 (7)
- January 2014 (13)
- December 2013 (11)
- November 2013 (15)
- October 2013 (15)
- September 2013 (18)
- August 2013 (5)
- July 2013 (20)
- June 2013 (33)
- May 2013 (8)
- April 2013 (16)
- March 2013 (25)
- February 2013 (14)
- January 2013 (20)
- December 2012 (23)
- November 2012 (23)
- October 2012 (25)
- September 2012 (14)
- July 2012 (12)
- June 2012 (43)
- May 2012 (20)
- April 2012 (8)
- March 2012 (40)
- February 2012 (39)
- January 2012 (40)
- December 2011 (22)
- November 2011 (40)
- October 2011 (33)
- September 2011 (48)
- August 2011 (40)
- July 2011 (58)
- June 2011 (41)
- May 2011 (80)
- April 2011 (38)
- March 2011 (33)
- February 2011 (25)
- January 2011 (24)
- December 2010 (3)
- November 2010 (7)
- October 2010 (6)
- September 2010 (7)
- August 2010 (1)
- July 2010 (2)
- June 2010 (4)
- May 2010 (1)
- March 2010 (3)
- February 2010 (3)
- December 2009 (5)
- November 2009 (2)
- October 2009 (3)
- July 2009 (3)
- June 2009 (1)
- April 2009 (1)
- March 2009 (1)
- February 2009 (1)
- January 2009 (1)
- December 2008 (2)
- October 2008 (1)
- September 2008 (1)
- July 2008 (1)
- March 2008 (2)
- January 2008 (2)
- October 2007 (1)
- September 2007 (3)
- July 2007 (1)
- March 2007 (1)
- February 2007 (3)
- November 2006 (3)
- August 2006 (1)
- February 2006 (1)
- May 2005 (1)
- February 2004 (1)
Data Store
London population set to decline for first time since 1988
7 January 2021: The Guardian reports today London population set to decline for first time since 1988 – picking up on some research issued as part of PWC’s 2021 UK and Global economic outlook. PWC’s research predicts the following: “Strikingly, London’s population could decline for the first time in the 21st century. Drivers of this would include city-dwellers rethinking their living situations in light of the pandemic, a smaller number of graduates arriving in the capital due to the rise of remote working, and reduced immigration“. This finding is one of 8 key predictions for 2021 for the UK – two of which are specifically around energy and climate issues:
- One in eight cars newly registered in Great Britain are likely to be electric or hybrid. With the transport sector accounting for a third of all carbon dioxide emissions, the UK will have to transition away from petrol and diesel cars if it is to meet its target of net zero emissions by 2050. Following years of progress, the UK has the potential to see 1 in 8 new cars be electric or hybrid in 2021.
- By the end of 2021, the majority of electricity generated in the UK could be from renewable sources. If it is to meet its net zero targets, the UK will need to transition away from fossil fuels and towards renewable energy sources. In the same year it is hosting the COP26, the UK could reach this historic milestone, showcasing its progress on the green agenda.
The full PWC study highlights that “In an August 2020 survey conducted by the London Assembly, 4.5% of Londoners – or 416,000 people – responded that they would definitely move out of the city within the next 12 months.11 Pre-COVID, the ONS predicted that London’s population would grow by 56,000 people between 2020 and 2021. It would require just 14% of these respondents to actually move in 2021 to break even with this projection.”
Continue reading…
Posted in Data Store, News
Tagged London Plan
Comments Off on London population set to decline for first time since 1988
Open Data: UK Power Networks
November 2020: An interesting new initiative from London’s (main) distribution network operator UK Power Networks (UKPN) providing “data for the first time, covering three themes: facilitating Net Zero, improving the network and informing strategy.” The initiative responds to the Energy Data Taskforce recommendations made in their 2019 report which highlighted that the energy transition is being impeded by often poor quality, inaccurate, or missing data, while valuable data is often restricted or hard to find.
There’s a lot here – a few quick points of interest to me:
- UK Power Network set out their pathway for opening up data in their Digital Strategy paper from December 2019 – available here
- Under the ‘Network Data’ tab an Embedded Capacity Register is available providing information on generation and storage resources (>1MW) that are connected, or accepted to connect to UKPN’s network. The spreadsheet does not mention the capacity of the asset connected – just the network characteristic the asset is connected to. The address search facility does allow for filtering just for London (UKPN covers the south-east and eastern regions in addition to London) – but does not seem to allow for London borough searches (at least not for all London boroughs). And as the register only lists those assets above 1MW, much of the distribution generation capacity in London isn’t captured here as it is below this level (they can be found through other tools however including the London Heat Map, Ofgem’s CHP register and also Feed in Tariff (FIT) datasets (here and here);
- The ‘Facilitating Net Zero’ tab includes data on: Connecting Distributed Generation; Electric Vehicle Connections in London; Electric Vehicle – Network Capacity and Electric Vehicle Future Constraint Map.
- And an interesting study undertaken by Element Energy for UKPN setting out Distribution Future Network Scenarios along with a large number of interesting forecast datasets of assets that could be connected to the network over the period to 2050.
Much more to explore here – and an important input for London boroughs working on their climate emergency plans. Great to see UKPN make this data available, and I hope they will continue to work with London local authorities to ensure that the datasets work for them.
Posted in Data Store, News
Tagged Distribution, Electric Vehicles, Photovoltaics, UK Power Networks
Comments Off on Open Data: UK Power Networks
82% of Londoners are concerned about climate change
19 November 2020: London Councils have published the results of a survey to to gauge Londoners’ understanding of climate change and the effect it has on their lives. The poll findings were launched at London Climate Action Week (14 – 20 November) and follow the adoption of net zero emission targets for the majority of London boroughs.
Some headline results below:
- 82% of Londoners are concerned about climate change, with 40% describing themselves as very concerned.
- 57% of Londoners say their level of concern has increased in the last 12 months
- Climate denial is close to non-existent. 2% of Londoners don’t believe in climate change.
- 87% of Londoners are motivated to help prevent climate change
- 59% of Londoners said climate change affects their decision making
- Almost half of Londoners (46%) consider the climate when making day-to-day purchases
Some really interesting results and should give pause for thoughts for many organisations, from local authorities to the private sector, in their decision-making processes. Much more info in the news release on the London Councils website.
Posted in Data Store, News
Tagged Data
Comments Off on 82% of Londoners are concerned about climate change
Latest London PV statistics
August 2016: The last set of sub regional Feed in Tariff (FIT) statistics published by DECC – before it is merged with the business department into BEIS – were published last week (available here). London PV data – alongside other UK regions – is reproduced below.
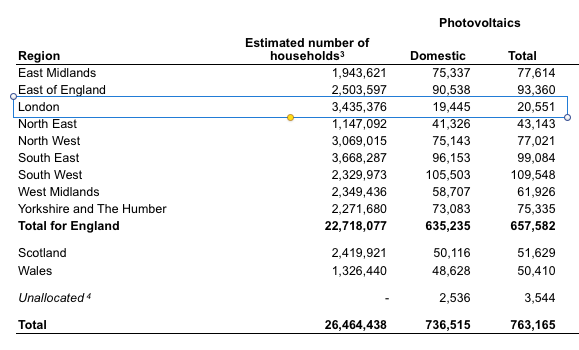
Table 1. Cumulative installations confirmed on the Central Feed-in Tariff Register by Region
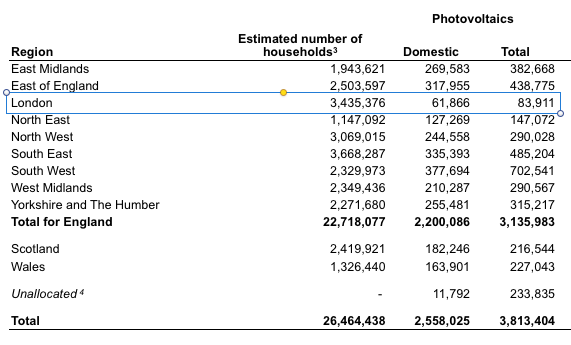
Table 2. Cumulative capacity confirmed on the Central Feed-in Tariff Register by Region
So – as at the end of June 2016:
- London had 20,551 PV installations (95% of which were domestic installations) with a total combined electrical generating capacity of 83.911MW.
- London’s capacity represented just 2% of total UK PV generating capacity
- The last FIT quarterly data set (for data up to the end of March 2016) reported that London had 20,123 PV installations in London and 81.623 MW – indicating a 2.28MW increase in capacity over the last three months.
Overview of CHP data
July 2014: CHP schemes – depending on size and fuel type – can benefit from a variety of government support mechanisms. These mostly take the form of partial exemptions from the Climate Change Levy, the Carbon Reduction Commitment (CRC), Carbon Floor Price, EU Emissions Trading Scheme, and business rates. Interaction with these mechanisms can be pretty complex at times (an overview of these are provided in the following presentations from an industry workshop last December) but critical to attaining these benefits is for the CHP scheme to achieve a ‘Good Quality’ status under the government’s CHPQA programme.
The CHPQA Standard highlights that the QA system has been place since around April 2001 providing “a methodology for assessing the quality of CHP Schemes in terms of their energy efficiency and environmental performance. This methodology is based on Threshold Criteria, which must be met or exceeded in order for the whole of the Scheme to qualify as ‘Good Quality’.” The QA programme also requires an annual submission from each CHP plant wishing to be classed as ‘Good Quality’ – and details on how to comply with this QA standard are set out in some comprehensive guidance notes posted on DECC’s CHPQA microsite here.
The CHPQA admits that “achieving CHPQA Certification may at first glance appear daunting” but fortunately, for the majority of schemes going forward in London (ie smaller scale), can access a more streamlined QA process which is available for <2MWe CHP plant (see guidance note 13). Overall, CHP schemes can be seen to go through some of the most rigorous monitoring requirements of all sustainable energy measures to receive government support.
CHP schemes in London that have achieved the CHPQA standard – and which have given consent for their details to be released – are listed on DECC’s Public CHP database here (set ‘region’ criteria to London). Aggregate CHP statistics are published in DECC’s Digest of UK Energy Statistics and regional (including London) data in the September issue of DECC’s Energy Trends journal. Further data can also be accessed on Ofgem’s CCL CHP register here. Additional detail on CHP and district heating schemes can be found on the London Heat Map.
DECC HECA Research
November 2013: All English local authorities were required to submit an updated Home Energy Conservation study report to DECC by 31 March 2013. An earlier post goes into these requirements in more detail and provides links to the report from those London boroughs who had posted them online on their website.
DECC have now published research summarising around 245 of these reports (see the Excel spreadsheet on the following link) as well as a document providing links to all reports published online. See both here. Only 20 London boroughs reports are however summarised on the spreadsheet. The HECA list states that some London boroughs have still not submitted reports: these appear to be Barking & Dagenham, Brent, Lambeth and Southwark.
It’s unclear if Bexley, Islington and Merton have submitted reports, as no links are listed – though the list does not say explicitly set out that these reports have not been provided: however, their actions are also not summarised on the spreadsheet.
Rundown on CHP in London
October 2013: Two recent sources issued by DECC provide data on the use uf Combined Heat and Power (CHP) plant in London. A useful article in DECC’s latest issue of Energy Trends provides a breakdown of CHP use in the regions, providing number of schemes, output, capacity installed and much more. Table 2 from the article is reproduced below.

The data shows a significant increase in the number of CHP schemes operating in London over the past two years (147 – 255) – a 73% jump – whilst generation capacity has grown by 29MW, reflecting the typically smaller scale nature (ie <1MWe) of CHP engines being installed in the capital. Of concern however is that Table 2B (below) from the article reveals that, though the capacity level of CHP has increased – the key metric – the output of decentralised lower-carbon heat and power in London – has actually fallen over the past two years. CHP electricity generation has fallen by 1% and heat generation by 2% in 2012 as compared to 2010 numbers. More promisingly however, the statistics indicate that the 2012 levels show a recovery a far steeper decline in output over the period 2010 to 2011 – so hopefully CHP is now ‘on the up’… Continue reading…
Green Deal by London Parliamentary Constituencies
September 2013: New Green Deal data released by DECC last week (see earlier post for full details) provides for the first time Green Deal assessments undertaken in each parliamentary constituency. It turns out that constituency with the highest number of assessments was a London one – Poplar and Limehouse. Table 1b of the dataset records assessments over the period January to June 30 2013 for each of the 573 UK constituencies. Poplar and Limehouse reports the highest number with 462 assessments: however another London constituency also records the lowest number – ‘Cities of London & Westminster‘ with only 3. To put these numbers in context, from the dataset it can be calculated that the average number of assessments undertaken to per constituency date is 75.
A full list of London parliamentary constituencies and number of Green Deal assessments taken – from highest to lowest – is provided below. Continue reading…
London seminar on measuring city GHG emissions
September 2013: C40 Cities and Siemens’ Infrastructure & Cities sector held a breakfast seminar in London earlier this month on methods to help improve the measurement of city greenhouse gas emissions. A C40 blog sets out discussions held on the day, which focussed around the Pilot Global Protocol for Community-Scale Greenhouse Gas Emissions. Further information on work taken to date on this initiative with 33 cities is posted at the World Resources Initiative (WRI) and full detail on the design of the tool is on the the GHG protocol website.
London has had an inventory in place for around a decade. The latest London Energy and Greenhouse Gas Inventory (LEGGI) was updated for 2011 data just over a month ago and is posted on the London Datastore – details of which are in an earlier post here.
Latest greenhouse gas inventory data for London published
September 2013: The London Datastore has recently posted detailed greenhouse gas emission data for London across a wide range of economic sectors. The spreadsheet for the 2011 update to the London Energy and Greenhouse Gas Inventory (LEGGI) provides estimates of energy consumption and CO2 emissions from Homes, Workplaces and Transport within the Greater London area and is produced by the GLA on an annual basis to measure progress against the Mayor’s Climate Change Mitigation and Energy Strategy.
The Department of Energy and Climate Change (DECC) also provide London emissions data (though not to the level of detail as that set out in the LEGGI) in a series of sub-regional statistics which can be downloaded here.
London & the Green Deal: An initial assessment
July 2013: DECC issued the first set of detailed quarterly Green Deal Statistics last week which provide include some limited regional results on the roll-out of the Government’s flagship energy efficiency programme. Hence, a picture of the activity in London to date is beginning to emerge. A number of information releases were published simultaneously on June 27 and are set out below, along with points to note for the capital:
- The data provided is for the Q1 2013 and hence only covers activity up to 31 March 2013. By that time, 9,294 Green Deal assessments had been undertaken in England. The press release issued on June 27 advises that the latest number of assessments carried out is 38,259.
- 10% of these 9,294 assessments were undertaken in London (set out in Table 1 on p12 of the statistical news release)
- An accompanying data spreadsheet provides a local authority breakdown of assessments undertaken. Southwark and Haringey observed the highest level of assessments in London over the first quarter, with 105 and 100 assessments respectively. Kensington & Chelsea, and the City of London the lowest with 1 and zero respectively. A ‘league table’ of London boroughs is provided below
- London boroughs (including the GLA) was awarded a total of £925,000 under DECC’s Green Deal Pioneer Places programme earlier this year. See earlier post for details. Consequently, a number of local authorities were providing Green Deal assessments to their residents free of charge. These offers ran up to May for some local authorities, hence assessment numbers for Q1 and Q2 will be boosted by the fact that homeowners are broadly having these services provided free over this period.
- The DECC data spreadsheet also provides detail on houses assessed (type of home, energy efficiency rating of home) and the measures recommended in the assessment. Though useful, this data does not provide any real indication of how many homes will be eventually install energy efficiency measures. DECC’s press release has Minister Greg Barker stating that “78 per cent of people who have received a Green Deal Advice Report, following a Green Deal assessment, said they had, were getting or would get energy saving measures installed.”
- In the run-up to the launch of the Green Deal and Energy Company Obligation (ECO), Government recognised that London had not received its fair share of funding from the energy supplier obligations in the past, however, they decided not to establish a London-specific ECO target as they were of the view that London should benefit under ECO as the programme is strongly focussed on the installation of solid wall insulation (SWI) and London has a large percentage of such homes. A real measure of success in the future will hence be the number of SWI installs in the capital. The latest Green Deal & ECO monthly statistics – issued alongside the quarterly statistics – highlight that 1,565 SWI installs were completed over the first quarter of 2013 across the UK. This is at a far lower rate than previous quarters in previous years (see quarterly progress of SWI in Table 1 of DECC Estimates of Home Insulation Levels in Great Britain – released alongside the GD/ECO statistics). Unfortunately, neither the monthly or quarterly statistics provide a regional breakdown of where these installations took place. This is something DECC will need to provide to help better understand if the ECO is being delivered in London.
- The Green Deal Cash Back offer, an initial ‘sweetener’ offered by Government on a first come – first served basis, has a pot of £125m. The quarterly statistics for vouchers issued by Government actually go beyond the first quarter – to 16 June 2013 – and show that £263k has so far been awarded. Unfortunately, no regional breakdown has been provided of where these vouchers have been awarded.
So, early days as yet for both the Green Deal and the ECO. More detailed data would be helpful to determine the progress of the programmes in London and elsewhere. It will be interesting to see the Mayor’s response to the Green Deal after an assessment is completed for his own home.
Green Deal assessments by borough are provided below and have been re-ordered from that provided in the quarterly spreadsheet into a ‘league table’ order.
Posted in Data Store, Energy Efficiency, News
Tagged DECC, ECO, Energy Efficiency, Green Deal
Leave a comment
London CRC Performance
April 2013: The Carbon Reduction Commitment (CRC) Performance Table was published a few weeks ago and attracted some media attention on who had gone up and down the table (see Guardian article here). The CRC is a complex mechanism and Government has had to return to tweak the policy time and again to simplify it. Along with the performance table, it appears the Chancellor’s view of simplification is, as set out in his Autumn Statement (December 2012), to get rid of the CRC altogether.
“1.127 The CRC’s Performance League Table will be abolished, to simplify the scheme further. A full review of the effectiveness of the CRC will be held in 2016 and the tax will be a high priority for removal when the public finances allow.”
For those new to the CRC, they should be made aware the original plan of the policy was to recycle the funds obtained from participants purchase of carbon permits, into sector-wide energy efficiency funding. The incoming Government however changed plans in 2010 and the Chancellor simply took all the funds into Government. It’s more than likely the Government would like to see the back of the CRC sooner, however, it does bring in close to £1bn to the Exchequer a year and this will increase again, as the 2012 Autumn Budget highlights: “2.88 The forecast allowance price remains unchanged at £12 per tonne of carbon dioxide in 2013-14 and £16 per tonne of carbon dioxide in 2014-15. From 2015-16 onwards, the allowance price will increase in line with the RPI.”
Back to the performance table: how did London do?