Site search:
-
What’s new?
Energy for London Tags
Brent Buildings Camden Carbon Emissions CHP Cities Climate Adaptation Community Heating Community Initiatives Croydon Data DECC Decentralised Energy Distribution ECO Energy Costs Energy Efficiency Enfield FIT Fuel Poverty Funding Green Deal Hackney Haringey Housing Islington Lambeth Library Local Authorities Mayor Newham Ofgem Olympics Photovoltaics Planning RE:FIT RE:NEW Renewable Energy Retrofit Southwark Tower Hamlets Transport Waltham Forest Waste WestminsterEnergy Archives:
- February 2021 (1)
- January 2021 (15)
- December 2020 (15)
- November 2020 (9)
- October 2020 (3)
- August 2020 (5)
- July 2020 (3)
- June 2020 (4)
- April 2020 (10)
- March 2020 (5)
- February 2020 (2)
- January 2020 (3)
- October 2019 (1)
- September 2019 (4)
- August 2019 (2)
- July 2019 (1)
- August 2018 (1)
- November 2016 (8)
- October 2016 (8)
- September 2016 (2)
- August 2016 (8)
- July 2016 (14)
- April 2016 (12)
- March 2016 (16)
- February 2016 (8)
- January 2016 (4)
- December 2015 (1)
- November 2015 (1)
- October 2015 (16)
- September 2015 (3)
- June 2015 (1)
- May 2015 (1)
- April 2015 (1)
- March 2015 (1)
- February 2015 (1)
- January 2015 (1)
- December 2014 (18)
- November 2014 (4)
- August 2014 (8)
- July 2014 (7)
- June 2014 (25)
- May 2014 (8)
- April 2014 (4)
- March 2014 (12)
- February 2014 (7)
- January 2014 (13)
- December 2013 (11)
- November 2013 (15)
- October 2013 (15)
- September 2013 (18)
- August 2013 (5)
- July 2013 (20)
- June 2013 (33)
- May 2013 (8)
- April 2013 (16)
- March 2013 (25)
- February 2013 (14)
- January 2013 (20)
- December 2012 (23)
- November 2012 (23)
- October 2012 (25)
- September 2012 (14)
- July 2012 (12)
- June 2012 (43)
- May 2012 (20)
- April 2012 (8)
- March 2012 (40)
- February 2012 (39)
- January 2012 (40)
- December 2011 (22)
- November 2011 (40)
- October 2011 (33)
- September 2011 (48)
- August 2011 (40)
- July 2011 (58)
- June 2011 (41)
- May 2011 (80)
- April 2011 (38)
- March 2011 (33)
- February 2011 (25)
- January 2011 (24)
- December 2010 (3)
- November 2010 (7)
- October 2010 (6)
- September 2010 (7)
- August 2010 (1)
- July 2010 (2)
- June 2010 (4)
- May 2010 (1)
- March 2010 (3)
- February 2010 (3)
- December 2009 (5)
- November 2009 (2)
- October 2009 (3)
- July 2009 (3)
- June 2009 (1)
- April 2009 (1)
- March 2009 (1)
- February 2009 (1)
- January 2009 (1)
- December 2008 (2)
- October 2008 (1)
- September 2008 (1)
- July 2008 (1)
- March 2008 (2)
- January 2008 (2)
- October 2007 (1)
- September 2007 (3)
- July 2007 (1)
- March 2007 (1)
- February 2007 (3)
- November 2006 (3)
- August 2006 (1)
- February 2006 (1)
- May 2005 (1)
- February 2004 (1)
Tag Archives: Data
Hills Fuel Data for London
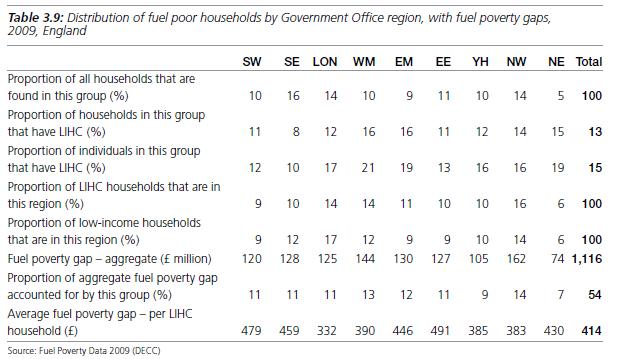
March 2012: The Hills Fuel Poverty report does provide a regional breakdown of data – as the interim did also – and highlights that:
“Table3.9 shows that London households are only slightly less likely to be fuel poor than others, although they do appear to be less deeply in fuel poverty on average, with a considerably lower average fuel poverty gap than other regions. There is a relatively even split between the broad regions in terms ofthe fuel poverty gap, so that region by itself would not be an effective targeting tool.”
 Further details on the report with links provided on an earlier post.
Low levels of FIT activity in London
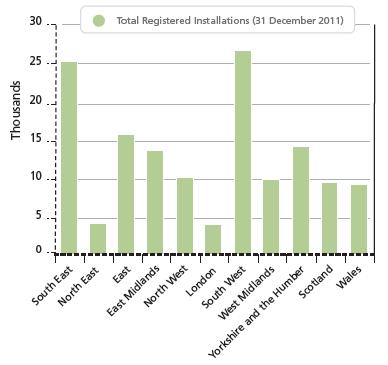
March 2012: Energy regulator Ofgem have just issued their latest quarterly report on the progress of Feed in Tariff (FIT) installations across the UK, providing details up to the end of 2011. As reported in a previous post, the last few months of 2011 has seen tremendous activity in relation to photovoltaics, due to the reduction in the support tariff levels from Government. The newsletter highlights that as at 31 December 2011, a total of 147,112 renewable installations have been registered under the scheme since 1 April 2010 (when the scheme started) of which, more than 65,000 installations were registered within the last three months.
Continuing from previous quarters, Ofgem report that photovoltaic (PV) installations continue to represent the vast majority of newly registered installations at over 99 percent of all installations registered between 1 October and 31 December 2011.
Ofgem fortunately also provides a regional breakdown of installations, which highlights a disappointing level of activity in London. In terms of the number of FIT installations, London appears to come at the bottom – just equal or below to the North East – with around 4,000 installations – significantly below all other regions (apart from the North East) – and only 1/6th as much as the best performing region. This number of installations in London represents less than 3% of the total as at December 2011.
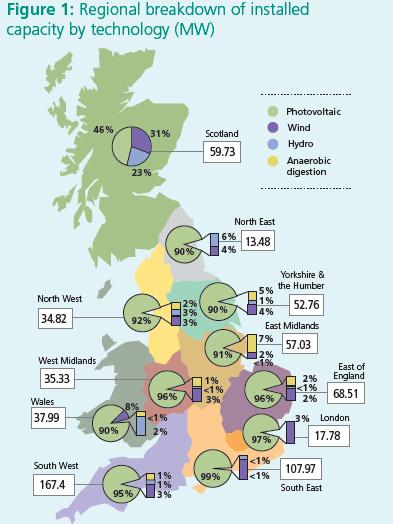
 Ofgem also helpfully provide the following regional generation capacity breakdown:
 Of the total 661.07MW of of generation capacity registered under the FITs scheme since 1 April 2010, London has the second lowest level of installed capacity at 17.78MW – just 2.7% of the total (only the North East is lower – a region which does after all have lower levels of insolation).
No analysis has been undertaken as yet to why some regions have been more successful than others, or what have been the key factors to the uptake of PVs. London certainly seems to have an active number of solar companies working within the capital and would have significant roof space, both domestic and non-domestic, that would be suitable for the installation of PVs. The high density of rented accommodation (as opposed to owner-occupiers) in London and typically higher costs associated with scaffolding may have been contributing factors. However, it is unlikely that they are the key determining factors in relation to identifying London’s poor performance.
Households treated under Warm Front in London Constituencies
February 2012: DECC have provided a spreadsheet showing the number of households assisted in each parliamentary constituency under the Government’s Warm Front scheme, for the years 2005/06 to 2011/12. The full list for English constituencies can be downloaded here. The spreadsheet filtered for London data can be downloaded here.
London housing market report Q3 2011
25 November 2011: Interesting data on key economic metrics for London as well as data in relation to housing growth in the capital. The GLA Housing Team briefing can be viewed here.
Hills Report Data on Number of Fuel Poor in London
November 2011: The consultation period on the interim report by the Hills Fuel Poverty Review has just closed (Nov 18), but an Excel spreadsheet containing the background data to the report has recently been released.
The spreadsheet tab (Fig B.7 & Table B.4) provides estimates of how the number of households in London would be classed as fuel poor depending on how the definition was set. Hence, under the current definition, 402,000 households in London are fuel poor: if the ‘After Housing Costs’ definition was instead adopted, this number would rise to 584,000. See previous posts on some of the background to this (here and here).
DECC list of Energy Data Resources
November 2011: DECC have just posted a “List of datasets that contain information on energy generation, transport, area wide emissions and buildings at UK and regional/local level”. This is an EXCELLENT and comprehensive list of links to energy data ranging from heat maps, decentralised energy plant, energy consumption data and lots of transport related statistics. A really valuable spreadsheet resource worth downloading. In case link doesn’t work in the future – the document can also be downloaded here.
Analysing Options for Carbon Reduction: Housing stock refurbishment tool
November 2011: The Energy Saving Trust have developed a housing stock refurbishment calculator, which enables local authorities to input an energy efficiency profile of the housing stock in their area and to analyse options for carbon reduction.
The tool is designed to inform four key areas to help local authorities and housing stock managers justify and plan a carbon reduction scheme:
The tool is currently under development and will soon be able to offer consultancy services in modelling using the tool. For further details, please contact localdelivery@est.org.uk
Home Energy Fact File 2011 Released
October 2011: DECC have just released the latest version of their comprehensive guide to energy use in homes – the Housing Energy Fact File 2011 (previously known as the Domestic Energy Fact File). The 2011 Fact File covers the period from 1970 to 2009, and aims to draw together most of the important data about energy use in homes in Great Britain. It is intended for policy-makers, researchers, and interested members of the public, and considers the relationship between domestic energy use and carbon dioxide emissions. The report provides information on all aspects of home energy use such as:
- Carbon emissions and energy generation trends from homes
- Household spending on energy
- How much energy is used in homes in areas such as Space heating, Hot water, Lights, Appliances and Cooking
- Energy efficiency (SAP) ratings
- Use of Central heating etc.
No regional representation of the data is unfortunately provided, so issues reflecting the very different housing mix in London (with high levels of: flatted accommodation, solid wall dwellings and privately rented homes etc.) and its relation to energy consumption are not unfortunately covered.
London Combined Heat and Power output falls
October 2011: DECC have just released their annual regional breakdown of Combined Heat and Power (CHP) statistics, providing further detail to the CHP chapter of DECC’s annual Digest of UK Energy Statistics, published in July of this year.
The statistics for London released indicate that:
- 188 Good Quality CHP schemes were operational in London as at the end of 2010
- These schemes amount to a total electrical capacity of 185 MWe and total thermal capacity of 372MWth
- They produced a total of 631GWh electricity and 1,680GWh heat – a total of 2,311 GWh energy
- Unlike many other regions, London does not have many large-scale industrial CHP schemes, which have typically long operational hours. Hence the overall load factor of London CHP schemes is low – the second lowest in the UK – at only 39.8%
- Importantly, whilst there has been a marginal increase in the number of CHP schemes operating in London (3 more in 2010) overall CHP generation capacity in London has decreased from 200MWe in 2009 to 185MWe. This is in despite an increase in overall increase in UK CHP capacity by over 500MWe.
- Additionally, when compared to last year’s statistics, the output from CHP plant in the capital has also fallen. CHP data as at the end of 2009 shows that CHP output stood at 746 GWh electricity and 2,414 GWh heat – a total of 3,160GWh of energy (see last year’s DECC Energy Trends September 2010 for details). Hence, as compared to the statistics just released, CHP energy output has dropped a significant 27% in the capital over one year. It’s difficult to determine exactly what is happening here without access to more detailed data for London from DECC – especially in relation to those schemes which may have retired.
- Note: there is a minor error in the latest Energy Trends article. Tables 5 & 6 suggest that 200MW CHP is operating in 2010. However, the report’s authors have clarified to energy for london that the correct capacity is 185 MWe and that:
- in Table 5 of the article, CCGT+GTs+STs should be 80 MWe and NOT 95 MWe. This will make the total for London 185 MWe, and consistent with Tables 1+2
- in Table 6 the London figure under the ’10 MWe and greater’ column should be 66 MWe and NOT 81MWe. This again will make the total for London 185 MWe, and consistent with Tables 1+2
Posted in Data Store, Decentralised Energy, News
Tagged CHP, Data, DECC, Decentralised Energy
Leave a comment
New Renewable Electricity Stats for London
30 September 2011: DECC have just released their annual regional breakdown of renewable electricity statistics, providing further detail to the renewable CHP chapter of DECC’s annual Digest of UK Energy Statistics, published in July of this year. (Note – this only refers to ‘renewable electricity’ and not ‘renewable energy’ which would include the contribution of renewables to heating and transport fuels also – the UK’s 2020 target is in relation to renewable energy).
The statistics for London indicate:
- 10 sites in London are indicated under the ‘wind and wave’ category to a total of 3.7 MWe. Virtually all of this capacity must be wind, and the vast proportion of it attributable to a single scheme – the Ford Dagenham wind turbine project.
- 6 schemes are classed under ‘other biomass’ a total of 110.6 MWe (note – these statistics only refer to ‘renewable electricity’ and not ‘renewable energy’, hence it does not include biomass heat-only schemes in London or elsewhere). The majority of this capacity must be from biogas to electricity schemes at Thames Water sewage waste water treatment plants, and also a Thames Water ‘sludge powered’ generator, and a number of landfill gas schemes.
- And then there are 1,044 solar PV schemes operating in London – to a total of 2.8MWe generation capacity (on PV installations in London see here for further detail).
- London has the lowest total overall renewable electricity output of all regions at 385GWh – exactly the same amount generated as in 2009 (see DECC Energy Trends September 2010 for details)
- The Mayor will shortly be issuing a detailed study on the potential for decentrailsed energy in London, including the use of renewable energy resources.
Posted in Data Store, News, Renewable Energy
Tagged Data, DECC, Mayor, Renewable Energy
Leave a comment
Latest Defra Greenhouse Gas Inventories
6 September 2011: Report presenting estimates of ALL six greenhouse gas (GHG) emission inventories for the constituent countries of the UK for 2009.
England has a 77.6% share of total net GHG emissions in 2009 and emissions have declined by 29.5% since the base year (which slightly differs for the different gases).
Overall UK CO2 emissions have fallen by 19.7% between 1990 and 2009, mainly driven by the installation of combined cycle gas turbines (CCGT) in the power generation sector in England and reductions in carbon dioxide emissions from industry in England, Scotland and Wales.

