Site search:
-
What’s new?
Energy for London Tags
Brent Buildings Camden Carbon Emissions CHP Cities Climate Adaptation Community Heating Community Initiatives Croydon Data DECC Decentralised Energy Distribution ECO Energy Costs Energy Efficiency Enfield FIT Fuel Poverty Funding Green Deal Hackney Haringey Housing Islington Lambeth Library Local Authorities Mayor Newham Ofgem Olympics Photovoltaics Planning RE:FIT RE:NEW Renewable Energy Retrofit Southwark Tower Hamlets Transport Waltham Forest Waste WestminsterEnergy Archives:
- February 2021 (1)
- January 2021 (15)
- December 2020 (15)
- November 2020 (9)
- October 2020 (3)
- August 2020 (5)
- July 2020 (3)
- June 2020 (4)
- April 2020 (10)
- March 2020 (5)
- February 2020 (2)
- January 2020 (3)
- October 2019 (1)
- September 2019 (4)
- August 2019 (2)
- July 2019 (1)
- August 2018 (1)
- November 2016 (8)
- October 2016 (8)
- September 2016 (2)
- August 2016 (8)
- July 2016 (14)
- April 2016 (12)
- March 2016 (16)
- February 2016 (8)
- January 2016 (4)
- December 2015 (1)
- November 2015 (1)
- October 2015 (16)
- September 2015 (3)
- June 2015 (1)
- May 2015 (1)
- April 2015 (1)
- March 2015 (1)
- February 2015 (1)
- January 2015 (1)
- December 2014 (18)
- November 2014 (4)
- August 2014 (8)
- July 2014 (7)
- June 2014 (25)
- May 2014 (8)
- April 2014 (4)
- March 2014 (12)
- February 2014 (7)
- January 2014 (13)
- December 2013 (11)
- November 2013 (15)
- October 2013 (15)
- September 2013 (18)
- August 2013 (5)
- July 2013 (20)
- June 2013 (33)
- May 2013 (8)
- April 2013 (16)
- March 2013 (25)
- February 2013 (14)
- January 2013 (20)
- December 2012 (23)
- November 2012 (23)
- October 2012 (25)
- September 2012 (14)
- July 2012 (12)
- June 2012 (43)
- May 2012 (20)
- April 2012 (8)
- March 2012 (40)
- February 2012 (39)
- January 2012 (40)
- December 2011 (22)
- November 2011 (40)
- October 2011 (33)
- September 2011 (48)
- August 2011 (40)
- July 2011 (58)
- June 2011 (41)
- May 2011 (80)
- April 2011 (38)
- March 2011 (33)
- February 2011 (25)
- January 2011 (24)
- December 2010 (3)
- November 2010 (7)
- October 2010 (6)
- September 2010 (7)
- August 2010 (1)
- July 2010 (2)
- June 2010 (4)
- May 2010 (1)
- March 2010 (3)
- February 2010 (3)
- December 2009 (5)
- November 2009 (2)
- October 2009 (3)
- July 2009 (3)
- June 2009 (1)
- April 2009 (1)
- March 2009 (1)
- February 2009 (1)
- January 2009 (1)
- December 2008 (2)
- October 2008 (1)
- September 2008 (1)
- July 2008 (1)
- March 2008 (2)
- January 2008 (2)
- October 2007 (1)
- September 2007 (3)
- July 2007 (1)
- March 2007 (1)
- February 2007 (3)
- November 2006 (3)
- August 2006 (1)
- February 2006 (1)
- May 2005 (1)
- February 2004 (1)
Tag Archives: Data
London energy data maps
January 2013: Tim Starley Grainger has posted some useful graphics on how London is faring under some key Government energy efficiency and renewable energy programmes, such as CERT, Warm Front and progress under the Feed in Tariffs (FITs). As highlighted in various posts on this site, it doesn’t make for cheerful viewing. Graphics posted here.
The Electric City
December 2012: Following last week’s LSE Cities ‘Electric City’ conference which took place at the fascinating ‘Former Shoreditch Electricity Generating Station & Refuse Destructor’ some material have been posted online.
- A series of essays on the theme Electric City have been brought together in a publication for the conference which can be downloaded here. There’s not much specifically on London’s energy challenges, but the Global Problems: City Solutions contribution highlights an interesting point suggesting that “According to some reports, urban regions already produce ten times more renewable technologies patents than rural regions.”
- A selection of video interviews from the conference are posted on Youtube
- And the Guardian has posted a series of ‘exclusive data visualisations’ from the conference which includes ‘Unpacking London: energy & pollution’ highlighting that “Three quarters of London’s energy consumption is fueled directly by oil and gas, with the vast majority of the remainder generated by fossil-fuel-powered electricity. Just 2.1% comes either direct from waste and renewables or from renewably-generated electricity.”
Waltham Forest has highest number of PV installations of any London borough
 24 October 2012: A recent post provided some regional detail of the uptake of Feed in Tariff (FITs) generators – predominantly photovoltaics (PVs) – across the UK (at the English regions and devolved administrations level). DECC have today released an updated spreadsheet providing a breakdown on the number of installations at local authority and parliamentary constituency level. This highlights that:
- London’s suburbs do the best in relation to PVs installed with Waltham Forest having the highest number of installs of all London boroughs (701); then Bromley (666), Croydon (525) and Havering (440).
- The parliamentary constituency of Walthamstow has accordingly the highest number of PV installations of any constituency in London (373). [For context, Tiverton in Devon has the highest number of installations of any UK constituency – 2,456]
- Unfortunately installed capacity (ie kWe of generation) by local authority/constituency is not available – which would be a more helpful metric (it is included available on a per installation basis in Ofgem’s comprehensive FIT spreadsheet (370k+ entries) – the latest of which was published a few weeks ago – and which Energy for London is currently going through and will report on shortly).
- A not very helpful map is also provided by DECC today of Number of domestic photovoltaic installations by Local Authority, as at end of September 2012
In addition to the direct link here the spreadsheet can also be downloaded from the following DECC FITs webpage (the file is called ‘Sub-regional Feed-in Tariffs confirmed on the CFR statistics‘).
Posted in Data Store, News
Tagged Bromley, Croydon, Data, FIT, Havering, Photovoltaics, Waltham Forest
Leave a comment
Renewable Electricity Generation in London begins to grow
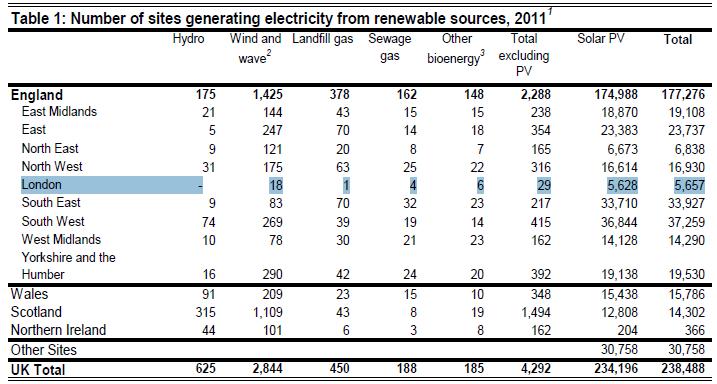
1 October 2012: DECC’s latest issue of Energy Trends includes new regional statistics on renewable electricity (not energy) generation. The article – Renewable electricity in Scotland, Wales, Northern Ireland and the regions of England in 2011– highlights (in Table 1) that 5,657 renewable electricity generating sites were operating in London as at the end of 2011. Not surprisingly the vast majority of these were photovoltaics (PV) – 99.48% to be precise – with a further 58 renewable technology schemes registered (this however compares with only 16 (non-PV) schemes as registered in last year’s statistics). The number of PV installations has risen more than fivefold compared to the number (1,044) in place at the end of 2010.
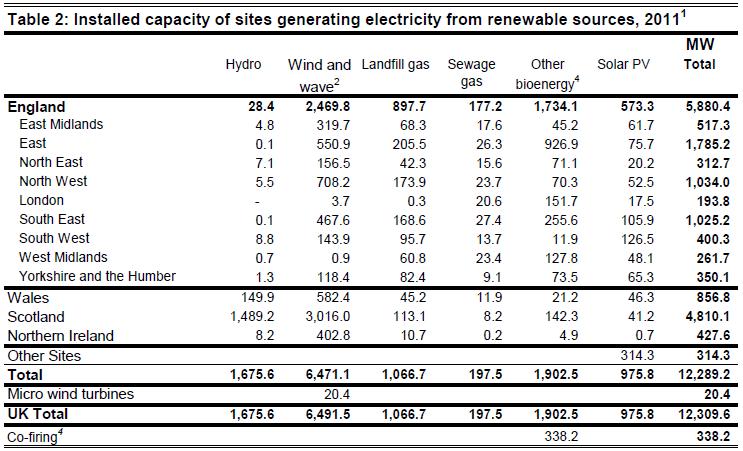
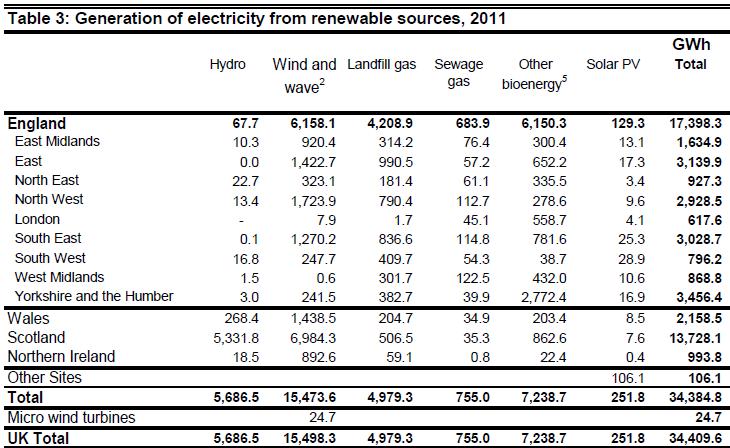
More importantly in terms of capacity and output, the following two tables (copied below) reveal that in 2011:
- London has 193.8 MW of electrical generating capacity (compared to 117.1 in 2010) – a 65% increase in renewable capacity over the year.
- PV capacity has risen six fold from 2.8 MW in 2010 to 17.5 MWas at the end of 2011
- However ‘Other biomass’ has seen the biggest overall increase in capacity – just over 40MW – over the year
- Oddly no sewage gas plants were registered in the 2010 statistics (a number of schemes have been operating in the capital for sometime…); it is now reported that 4 schemes operate in London to a total generating capacity of 20.6 MW.
- The ‘Wind and Wave’ category has increased by 8 in terms of installation numbers (10 to 18), however the capacity number remains the same – 3.7 MW – as of last year.
Following the level of overall renewable capacity added, there’s been a 60% increase in the amount of renewable electricity generated, rising from 385.7 GWh (gigawatt-hours) in 2010 to 617.6 GWh in 2011 (see table below).
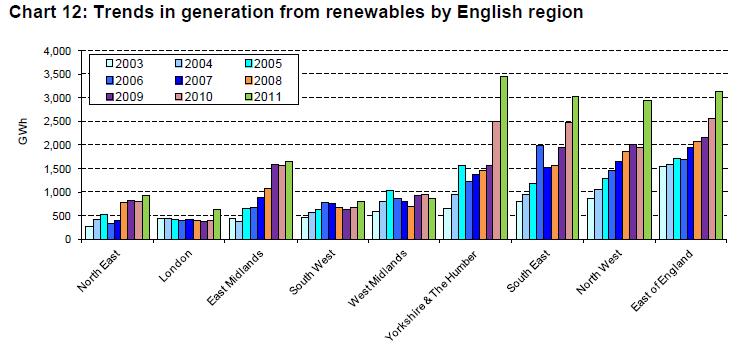
The article provides further analysis and comparisons of London’s output as compared to the rest of the English regions, which, as is already well documented, remains modest due to the limitations the capital has in exploiting key renewable technologies such as wind and landfill. Chart 12 in the article (copied below) however provides some cause for optimism as it illustrates that changes made to the national policy framework for renewables over the past few years- particularly with the advent of Feed in Tariffs (FITs) and Renewable Obligation (RO) Banding – is finally supporting London to take a small but positive step forward in terms of its renewable contribution, after several years of only limited progress.
Posted in News, Renewable Energy
Tagged Anaerobic Digestion, Data, Photovoltaics, Renewable Energy, Waste
Leave a comment
Statistics on new housing starts and completions in each local authority in London
September 2012: Recent parliamentary question in the House of Commons provides a useful summary on where London housing statistics are kept and collated.
Statistics on new housing starts and completions in each local authority in London, taken from the National Statistics on House Building, are published in live table 253 on the Department for Communities and Local Government’s website which is available on the following link.
These statistics show starts and completions split by tenure according to whether the organisation responsible for the development is a private company, a housing association or a local authority. The figures for housing associations and local authorities can together be used as a proxy for affordable housing starts and completions. However, these figures may underestimate affordable housing supply and overestimate private housing, as they are from building control records in which the ultimate tenure may be difficult to identify.
Statistics on the full extent of affordable housing supply by local authority are published in the Department’s live tables 1006, 1007 and 1008, which are available at the following link.
From 1 April 2012, the Mayor of London has had oversight of strategic housing, regeneration and economic development in London.
Greenhouse Gas summary reports
15 June 2012: DECC have issued a series of useful summary documents on greenhouse emissions related to key sectors:
- GHG Inventory summary factsheet: energy supply
- GHG Inventory summary factsheet: public sector
- GHG Inventory summary factsheet: residential
- GHG Inventory summary factsheet: transport
- GHG Inventory summary factsheet: waste
- GHG Inventory summary factsheets – amalgamated document
- Carbon dioxide factsheet
- All gas factsheets as single document
Posted in Data Store
Tagged Carbon Emissions, Data, Housing, Local Authorities, Waste
Leave a comment
Use of GIS to determine domestic energy efficiency potential
June 2012: Presentation by the Energy Saving Trust (EST) on helping overcome what EST say is the “disconnect between data managers and delivery teams when delivering retrofit schemes.”
Heat Maps produced for every London borough
June 2012: The London Heat Map project has now posted online heat map reports and datasets for every London borough. Information provided sets out that “The new heat maps are higher resolution with real heat consumption data for priority buildings such as hospitals, leisure centres and local authority buildings. As part of this work, each of the boroughs has developed implementation plans to help them take the decentralised energy opportunities identified to the next stages. The implementation plans include barriers and opportunities, actions to be taken by the council, key dates, personnel responsible.”
Posted in Data Store, News
Tagged CHP, Community Heating, Data, Heat Maps, London Heat Map
Leave a comment
Map of London District Heating Schemes
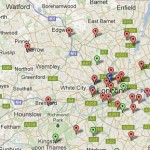 June 2012: The London Heat Map captures a lot of the data related to Combined Heat and Power (CHP) and district heating schemes operating in the capital, but the CHPA have added a welcome web resource – a map of UK district heating schemes which includes a good number of London schemes. DECC also provides a list of CHP schemes operating in London – it’s not comprehensive however as operators are not required to have their details listed. Hence, only 32 schemes are listed on the DECC Public CHP database of the 188 schemes DECC state are operating in London in their latest regional CHP statistics.
Posted in Data Store, News
Tagged CHP, Community Heating, Data, Decentralised Energy
Leave a comment
Free London Mapping Tool
May 2012: From the London Datastore website:
‘Have you ever wanted to create a quick thematic map of London but lacked the GIS skills or software to do it yourself?
There is a free mapping tool from the GLA Intelligence Unit that allows the user to input their own borough data to create an instant map that can be copied over into Word or another application of their choice. More information and the tool itself can be found here.’
‘London to test ‘smart city’ operating system’
May 2012: BBC News story reporting that “An operating system designed to power the smart cities of the future will be put through its paces in London. With partners including Hitachi, Phillips and Greenwich council, it aims to use the Greenwich peninsula as a testbed for new technologies running on the system. The OS aims to connect key services such as water, transport, and energy.”
Further information is available on Living Plan IT’s website which states “The Urban Operating System (UOS™) is the core technology platform that will manage vast amounts of data across cities and urban spaces and thereby facilitate smarter, sustainable and intelligent-living. This, in turn, will lead to more efficient use of energy and other resources, providing the basis for innovative services for residents, businesses and governments as well as new jobs and exports.”
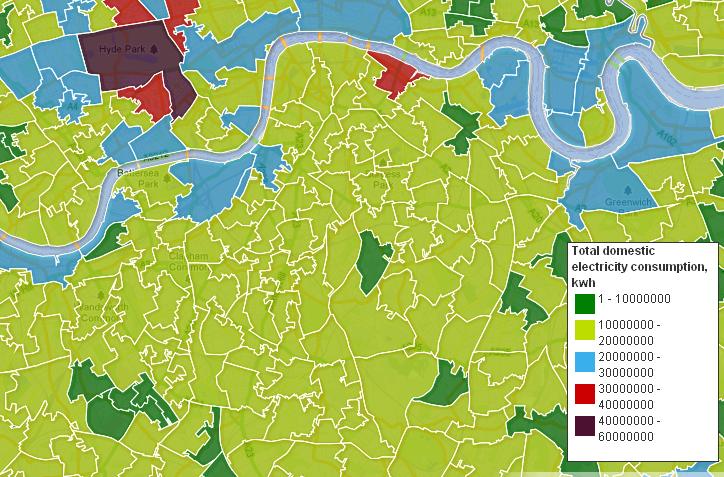
Domestic Electricity use map of Britain
2 April 2012: The Guardian has utilised the data released by DECC last week to produce this map of domestic electricity consumption across the UK.
The map can be accessed on the Guardian’s datablog website


