
Site search:
-
What’s new?
Energy for London Tags
Brent Buildings Camden Carbon Emissions CHP Cities Climate Adaptation Community Heating Community Initiatives Croydon Data DECC Decentralised Energy Distribution ECO Energy Costs Energy Efficiency Enfield FIT Fuel Poverty Funding Green Deal Hackney Haringey Housing Islington Lambeth Library Local Authorities Mayor Newham Ofgem Olympics Photovoltaics Planning RE:FIT RE:NEW Renewable Energy Retrofit Southwark Tower Hamlets Transport Waltham Forest Waste WestminsterEnergy Archives:
- February 2021 (1)
- January 2021 (15)
- December 2020 (15)
- November 2020 (9)
- October 2020 (3)
- August 2020 (5)
- July 2020 (3)
- June 2020 (4)
- April 2020 (10)
- March 2020 (5)
- February 2020 (2)
- January 2020 (3)
- October 2019 (1)
- September 2019 (4)
- August 2019 (2)
- July 2019 (1)
- August 2018 (1)
- November 2016 (8)
- October 2016 (8)
- September 2016 (2)
- August 2016 (8)
- July 2016 (14)
- April 2016 (12)
- March 2016 (16)
- February 2016 (8)
- January 2016 (4)
- December 2015 (1)
- November 2015 (1)
- October 2015 (16)
- September 2015 (3)
- June 2015 (1)
- May 2015 (1)
- April 2015 (1)
- March 2015 (1)
- February 2015 (1)
- January 2015 (1)
- December 2014 (18)
- November 2014 (4)
- August 2014 (8)
- July 2014 (7)
- June 2014 (25)
- May 2014 (8)
- April 2014 (4)
- March 2014 (12)
- February 2014 (7)
- January 2014 (13)
- December 2013 (11)
- November 2013 (15)
- October 2013 (15)
- September 2013 (18)
- August 2013 (5)
- July 2013 (20)
- June 2013 (33)
- May 2013 (8)
- April 2013 (16)
- March 2013 (25)
- February 2013 (14)
- January 2013 (20)
- December 2012 (23)
- November 2012 (23)
- October 2012 (25)
- September 2012 (14)
- July 2012 (12)
- June 2012 (43)
- May 2012 (20)
- April 2012 (8)
- March 2012 (40)
- February 2012 (39)
- January 2012 (40)
- December 2011 (22)
- November 2011 (40)
- October 2011 (33)
- September 2011 (48)
- August 2011 (40)
- July 2011 (58)
- June 2011 (41)
- May 2011 (80)
- April 2011 (38)
- March 2011 (33)
- February 2011 (25)
- January 2011 (24)
- December 2010 (3)
- November 2010 (7)
- October 2010 (6)
- September 2010 (7)
- August 2010 (1)
- July 2010 (2)
- June 2010 (4)
- May 2010 (1)
- March 2010 (3)
- February 2010 (3)
- December 2009 (5)
- November 2009 (2)
- October 2009 (3)
- July 2009 (3)
- June 2009 (1)
- April 2009 (1)
- March 2009 (1)
- February 2009 (1)
- January 2009 (1)
- December 2008 (2)
- October 2008 (1)
- September 2008 (1)
- July 2008 (1)
- March 2008 (2)
- January 2008 (2)
- October 2007 (1)
- September 2007 (3)
- July 2007 (1)
- March 2007 (1)
- February 2007 (3)
- November 2006 (3)
- August 2006 (1)
- February 2006 (1)
- May 2005 (1)
- February 2004 (1)
Library
Fuel Poverty by London constituencies
June 2014: The number of fuel poor households ranked by London Parliamentary constituencies, as set out in DECC’s latest ‘2012 sub-regional fuel poverty data: low income high costs indicator‘ dataset, is provided below:
London fares worst under government energy efficiency programmes
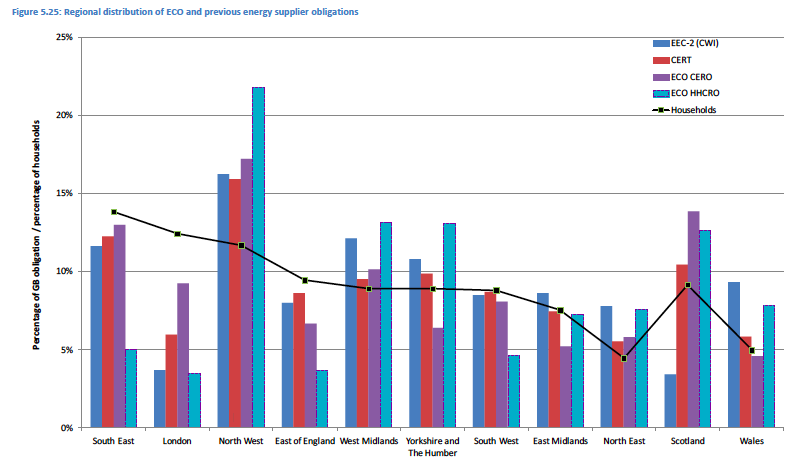
June 2014: An independent evaluation of the first year (2013) of the operation of the Energy Company Obligation (ECO), undertaken by the Centre for Sustainable Energy (CSE) for industry trade association Energy UK, has recently been published and highlights the low levels of funding directed to the capital.
The study ‘The ECO: An Evaluation of Year 1‘ includes a comparison of regional distribution of ECO spend and previous energy supplier obligations and reports – that across these major energy efficiency programmes:
“London has fared the worst, because although it has the second highest population, it obtained the second lowest number of EEC-2 cavity wall insulation installations (after Scotland), the third lowest number of CERT measures (after Scotland and the North East, which have lower populations), and the third lowest number of HHCRO households (after the East of England and the South West). London has a higher number of CERO households, but relative to its population this is still low.”
The following graph from the CSE report provides an illustration of this:
A summary of the report’s findings are available here. The full report is available here.
Government has previously stated that the ECO would support the uptake of ‘hard to treat’ measures, which would work better for London, and hence a regional target would not be needed (see para 53 onwards from November 2011 DECC ‘Green Deal & ECO consultation document‘). It may be that DECC now needs to look at this issue again under the current ECO consultation.
London Fuel Poverty statistics
12 June 2014: Announcements on the government’s work around fuel poverty have been fairly quiet of late. Activity in 2012 and 2013 was mainly focused around defining what fuel poverty actually was (more of which here and here) which ran in parallel with trying to get ECO (the Energy Company Obligation), the government’s main funding mechanism to help fuel poor households, to work. Less than a year into operation, the ECO is now facing some major changes (further information here) as a result of the Prime Minister’s attack on ‘Green Crap‘ and the government’s plans on how to address fuel poor households seem tied up to a forthcoming strategy fuel poverty strategy, a consultation document on which is to be issued ‘in due course’.
In the meantime, DECC have today released their latest annual fuel poverty statistics (announcements of which are here and here) reporting that the “the number of households in fuel poverty in England was estimated at around 2.28 million, representing approximately 10.4 per cent of all English households. This is a fall from 2.39 million households in 2011 (a reduction of almost 5%).” The government provide fuel poverty numbers against both the old definition (where fuel poor households are those which have to spend more than 10% of income on energy) and the new ‘Low Income High Costs indicator (LIHC)’ definition.
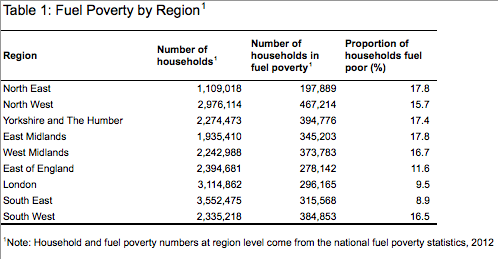
The data sets are given some context in the annual fuel poverty report, also released today, which includes a regional breakdown of information, providing some data on the number of fuel poor households in London. This includes the following:

London is reported to have a lower incidence of fuel poverty than other regions. Page 41 of the report states that “a combination of smaller household sizes and greater access to the gas network in London is likely to limit the average depth of fuel poverty experienced by Londoners.” The report does also highlight that, compared to some other regions, London has experienced a smaller reduction to the number of fuel poor households over the decade (as illustrated above).
The breakdown of data against the LIHC and 10% indicators is also set out in two datasets (below) which differ slightly in numbers but basically report that close to 1 in 10 households in the capital may well be struggling to pay their energy bills. With the National Audit Office reporting last year that utility bills are forecast to increase above inflation to at least 2030, it’s clear that both householders and government need to place far greater urgency on making homes more energy efficient.
2012 sub-regional fuel poverty data: low income high costs indicator
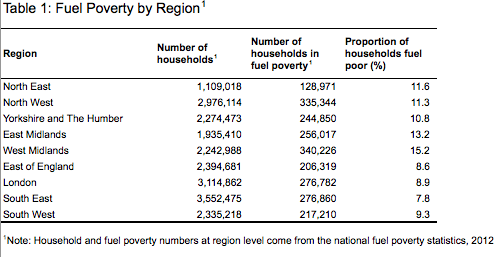
2012 sub-regional fuel poverty data: 10% indicator
Posted in Library, News
Leave a comment
District Energy in Cities
May 2014: Interesting to see that UNEP are now looking more in depth of the role of district heating in cities. UNEP state that “It is time for a redefinition of District Energy. It is no longer exclusively about heat or surplus energy, the traditional drivers of district energy. It’s about local production and consumption – and not only at a building level. It’s about sharing energy between buildings. And it’s about resource efficiency.DES is not a technology, but an approach to applying technologies to co-ordinate heat/cool/power supply. It represents a paradigm shift in urban planning which includes utility services as a component of community development.”
A document ‘District Energy in Cities: Policies for Deployment’ is currently in preparation. Details here.
Urban Infrastructure Initiative
May 2014: The outcomes of the WBCSD Urban Infrastructure Initiative (UII) suggest that all cities seeking to realize their sustainability objectives can benefit from engaging with business early in the planning and strategy development process. Early engagement leverages the capability of business to identify innovative and cost-effective solutions to complex, cross-cutting urban sustainability challenges. This final report summarizes the work done in these cities and highlights the lessons learned and potential applications where the early collaborative engagement with business should be considered by cities.
Posted in Library
Leave a comment
Heatwave Plan for England
14 May 2014: A new Heatwave Plan for England has been published today by the Public Health England. With respect to London, the Plan mentions:
- Extreme temperatures on the London Underground network could lead to a range of health and safety challenges.London Underground network operations monitor Met Office weather forecasts, and if temperatures are forecast not to fall below 24°C for three days running they will get ready to implement plans to deploy hot weather notices and bottled water supply, as well as measures to prevent track buckling.
- On a critical issue for London which is air pollution, the Plan states that – smogs typically accompany heatwaves as these often occur during periods of limited dispersion and /or easterly continental air masses arriving in the UK. As a result pollutants are less well spread or added to a higher background concentration which can lead to high concentrations of nitrogen dioxide and particulate matter. Heatwave conditions often lead to increased ozone levels following interactions of other pollutants with sunlight.
The Heatwave Plan also mentions a number factors which are likely to put increasing pressure on the supply of electricity – something which is likely to become more important as climate change impacts grow:
- At a time when energy companies traditionally maintain power stations for the winter by standing units down over the summer, rising temperatures increase the demand for supply due to the use of air-conditioning units and reduce the power-carrying capacity of the system, as it is harder to cool conductors – this will restrict the ‘maintenance window’ available and could ultimately require greater redundancy on the system to permit maintenance.
- Rising temperatures cause cooling problems for power stations as they are unable to cool components. This effect has been experienced in France, but not yet to a serious extent in the UK.
- High air temperatures are more of a problem and nuclear reactors can trip out at above 40°C, although this has never yet been reached at any site (38°C being the record).
- Rising temperatures lower power station efficiency. This effect is of lower concern than the two effects above.
London Energy Efficiency Programme Scrutinised
March 2014: The London Assembly Environment Committee held the first of two oral evidence sessions on progress made by the GLA’s energy and climate programmes. The first of these sessions was held on 6 February and focussed on the Mayor’s home energy efficiency programme, RE:NEW. Evidence was provided by representatives from a number of organisations, including EDF Energy, the Energy Saving Trust, Hillingdon Borough Council and the Mayor’s Housing Advisor. The full transcript can be accessed here – and a webcast can also be viewed here. Points of interest raised during the debate included:
- The RE:NEW programme is awaiting confirmation they they have been successful in their application to the European Investment Bank’s European Local Energy Assistance (ELENA) programme for £2.6m to put in place a support team over a three year period starting from April 2014 (the RE:NEW programme support team is currently operated for the GLA by Capita).
- RE:NEW is currently working with Greenwich, Havering, Newham and Westminster, Hyde Housing and Peabody Gallions developing “bigger projects that would be more attractive in terms of bringing in Energy Company Obligation (ECO) funding“.
- Borough responses suggested that RE:NEW was “not very hands-on with project development.” RE:NEW is keen to find out what boroughs are doing but “there is very little support there for boroughs in terms of developing projects and overcoming planning issues.“
- RE:NEW should be instead be focussing on what the GLA could do to “enhance [borough activities] even further if it wants to deliver ambitious carbon reduction targets“
- Further criticism was targeted at the RE:NEW programme stating that the funding resource was mainly going to Capita : “We see that the resources are actually on those people, basically, for the Capita resource. Local authorities are not really getting the benefit of that on the whole“.
- An often confusing debate takes place on how many homes were retrofitted through the RE:NEW programme and how many homes were insulated across London in total. A number of 400,000 homes is quoted by the Mayor’s Housing Advisor during the session. Though not explained, this number is most likely made up of the following: 327,00 treated through the Government’s CERT programme over the period April 2008 – December 2012 (see cell V35 of EST CERT data here), and 70,000 homes visited by the RE:NEW team and provided with ‘easy measures’ over the period July 2011-December 2012 (see MQ here for details). For more on this, see earlier post here.
- RE:NEW Phase 3 has a target of retrofitting 175,000 homes.
Just ahead of the evidence session – somewhat belatedly – the Mayor published the full evaluation report of the main RE:NEW roll-out phase which ran from July 2011-May 2012 (a summary report had previously been issued – details here). A second oral evidence session will take place on 26 March, focusing on the Mayor’s decentralised energy programmes, with the Mayor’s energy advisor, Matthew Pencharz, in attendance.
Posted in Energy Efficiency, Library, News
Tagged ECO, Energy Efficiency, Greenwich, Havering, Hillingdon, Newham, RE:NEW, Westminster
Leave a comment
London office energy use
February 2014: A new report produced by the UK Green Building Council’s (UKGBC) Zero Carbon Non Domestic Task Group examines the case for action supporting zero carbon non domestic buildings by 2019. The report includes the following information on energy consumption in London office buildings.
“Figure 3 demonstrates the impact of building regulations in a portfolio of London office buildings constructed since 1998. In particular the 50% decrease in ‘landlord and shared services’ energy is consistent; landlord and shared service energy is, in the majority, regulated energy which is covered by the building regulations. The variation in occupier direct energy use reflects the variation in densities, small power and hours of operation.”

The report can be downloaded here.
Transforming Cities
January 2014: Report of a meeting held by the Rockerfeller Foundation’s Resilient Cities programme – Transforming Cities: Visions of a Better Future – provides some case studies of how global cities are responding to increasing demands for energy. Linked to this, one of the report’s ‘key insights’ is that “Scarce resources, unknowns such as climate change and mass migrations into cities will overwhelm existing city planning capacity.” A sobering read of future city-stresses.
Urban Green Infrastructure
15 November 2013: The Parliamentary Office of Science & Technology has just produced a short briefing note on ‘Urban Green Infrastructure’ which “summarises research evidence of the effectiveness of green infrastructure, and challenges to its implementation.” It includes reference to ‘cooling the urban heat islands‘ stating:
“Urban areas often experience elevated temperatures compared with the surrounding countryside, because of extensive heat absorbing surfaces, such as concrete and tarmac, concentrated heat production and impeded air flow. For example, the centre of London is on average 5°C warmer than surrounding rural areas.”
Read the full POST note here.
Potential for biodiesel from use cooking oil and FOGs in London
November 2013: The Mayor announced today that TfL will be deploying 12o buses from the Barking depot which will run on a blend of 80 per cent regular diesel and 20 per cent biodiesel. The press release states that “Biodiesel is a renewable, clean-burning fuel made from used cooking oil from the catering industry and tallow which is a residue from the meat processing trade. It is estimated that buses running on biodiesel produce 15 per cent less ‘well to wheel’ carbon emissions than an ordinary diesel-powered bus…No mechanical change is needed to allow a bus to run on a 20% blend of biofuel. The biodiesel in this trial is being supplied by Argent Energy with the standard diesel supplied by Prax Petroleum.”
The GLA also commissioned consultants LRS to produce a report on the market opportunity for a biodiesel market in London using used cooking oil (UCOs), fats oils and grease (FOGs) from commercial and domestic sources in the capital. The report can be downloaded here and sets out to “evaluate the potential to reduce the emissions and carbon footprint of the bus fleet in London by using up to B30 biodiesel instead of petrodiesel. Additional sustainability benefits would be achieved by using biodiesel made from used cooking oil (UCO) and fats, oils and greases (FOGs) instead of virgin oils.”
The report references recent disputes in London over UCO (see Daily Telegraph story here) stating “only 3-4 years ago illegal disposal of UCO down drains was recognised to be a significant issue, recently the demand for UCO has soared and led to ‘Cooking Oil Wars’, whereby collectors pay increasingly escalating prices to commercial organisations for UCO.”
In terms of London’s potential to produce biodiesel, on the basis of national estimates, the report suggests that using the “ratio of London’s population to the national population and uplifting to reflect the greater concentration of catering establishments in London gives an estimate of 32-44 million litres of UCO waste arisings in the London area. There are nearly 24,000 food and beverage service activities in London, along with a further 835 businesses in London working in the food manufacturing sector, most of which contribute to the production of UCOs. In particular London has over 8,000 fast food outlets, with some of the highest concentrations of such food outlets in the country.”
Lot of interesting findings in this comprehensive report. More on biodiesel use in London here.
“The Rise of Distributed Generation”
October 2013: PWC’s latest annual energy and utilities survey – ‘Energy Transformation: The impact on the power sector business model‘ is proving quite a stir as a result of its findings on the future of the electricity generation sector. An incredible “82% see distributed power generation as ‘an opportunity’ versus only 18% rating it as a ‘threat’.”
The Executive Summary sets out that “The growth of distributed generation and its threat to the power utility business model depends on technological developments and cost. Its rise in Europe has been subsidy-driven. Cost barriers remain in the way of it being truly market-driven. But, if these barriers can be overcome, they could set the scene for widespread global industry transformation. Many believe that point is within reach. Energy efficiency, falling solar prices, demand-side management and smart grid technology head the list of technological developments that the industry believes will have the biggest impact on their power markets.“
“At the moment we are beginning to come to the end of a phase where the spread of distributed generation has been policy and subsidy-led. With the economics of distributed generation fast changing, we are likely to move into a phase where take-up is commercially and market-led.” [p17]
The growth of smaller scale, localised distributed – or decentralised – energy generation technologies is critical in helping cities such as London determine their own energy future. Many of the larger scale centralised generation plant currently in operation reflected the opportunities that were available at the time: coal power stations were sited near coal-seams; the 1990s ‘dash for gas’ led to a dramatic increase of new ‘Combined Cycle Gas Turbine’ (CCGT) plants, often situated close to gas terminals. Increasingly, smaller, cleaner energy systems, from PV to CHP, heat pumps to district heating schemes, are becoming technologies of choice: importantly they are sited at the place of demand – where consumers actually need to use power and heat. It’s therefore good to see such significant support for this dramatic change in this timely and important analysis.