12 June 2014: Announcements on the government’s work around fuel poverty have been fairly quiet of late. Activity in 2012 and 2013 was mainly focused around defining what fuel poverty actually was (more of which here and here) which ran in parallel with trying to get ECO (the Energy Company Obligation), the government’s main funding mechanism to help fuel poor households, to work. Less than a year into operation, the ECO is now facing some major changes (further information here) as a result of the Prime Minister’s attack on ‘Green Crap‘ and the government’s plans on how to address fuel poor households seem tied up to a forthcoming strategy fuel poverty strategy, a consultation document on which is to be issued ‘in due course’.
In the meantime, DECC have today released their latest annual fuel poverty statistics (announcements of which are here and here) reporting that the “the number of households in fuel poverty in England was estimated at around 2.28 million, representing approximately 10.4 per cent of all English households. This is a fall from 2.39 million households in 2011 (a reduction of almost 5%).” The government provide fuel poverty numbers against both the old definition (where fuel poor households are those which have to spend more than 10% of income on energy) and the new ‘Low Income High Costs indicator (LIHC)’ definition.
The data sets are given some context in the annual fuel poverty report, also released today, which includes a regional breakdown of information, providing some data on the number of fuel poor households in London. This includes the following:

London is reported to have a lower incidence of fuel poverty than other regions. Page 41 of the report states that “a combination of smaller household sizes and greater access to the gas network in London is likely to limit the average depth of fuel poverty experienced by Londoners.” The report does also highlight that, compared to some other regions, London has experienced a smaller reduction to the number of fuel poor households over the decade (as illustrated above).
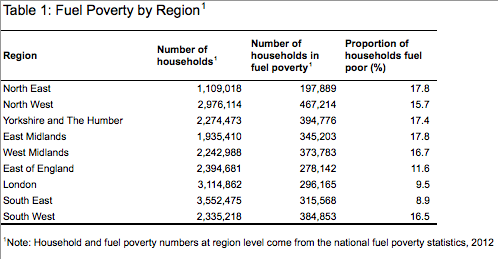
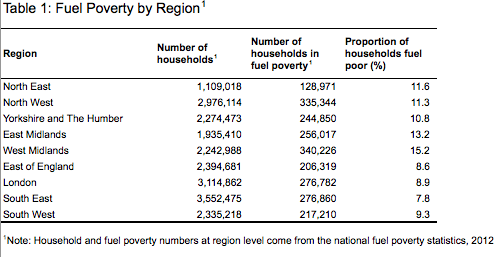
The breakdown of data against the LIHC and 10% indicators is also set out in two datasets (below) which differ slightly in numbers but basically report that close to 1 in 10 households in the capital may well be struggling to pay their energy bills. With the National Audit Office reporting last year that utility bills are forecast to increase above inflation to at least 2030, it’s clear that both householders and government need to place far greater urgency on making homes more energy efficient.
2012 sub-regional fuel poverty data: low income high costs indicator
2012 sub-regional fuel poverty data: 10% indicator