
June 2014: DECC have just released their 2014 Annual Fuel Poverty Statistics Report, accompanied by a dizzying number of data sets (all for 2o12), which attempt to detail fuel poor households by housing type, who lives there, by region etc.etc. The headlines of all this work is that government estimate that, in 2012, absolute numbers of fuel poor households had fallen slightly, when compared to previous years, to approximately 10% of all households in England. The overall change in the number of households in fuel poverty was relatively small – with the reduction happening mainly due to income increases for higher income fuel poor households. However, it’s also reported that the number of households in fuel poverty is projected to increase in 2014, with increases in energy costs a key factor.
Key findings include:
- The importance of energy efficiency: households are far less likely to suffer fuel poverty if they live in a better insulated home
- The much higher incidences of fuel poverty in unemployed households, and those living in privately rented accommodation.
Though the data indicates a lower proportionof fuel poor households in London than other regions (attributed in the report to higher incomes in London and greater access to the gas grid) the findings above are of particular importance to the capital due to the high (and increasing) number of households living in the privately rented sector, and the much lower levels of activity achieved by the government’s energy efficiency programmes in London.
The recent changes adopted by government in how to define when a household is in fuel poverty (as set out in the government’s 2013 ‘Fuel Poverty: A Framework for Action) – under a new ‘Low Income Household Costs’ (LIHC) indicator – specifically takes housing costs into account for the first time. Not surprisingly, this was thought to have a significant impact to the numbers of fuel poor in London due to the higher housing costs observed in the capital – with a predicted near 50% increase in the number of fuel poor households (see here for details). The Fuel Poverty report doesn’t however appear to provide any commentary on how differences between regional housing cost differences may have impacted on fuel poverty numbers.
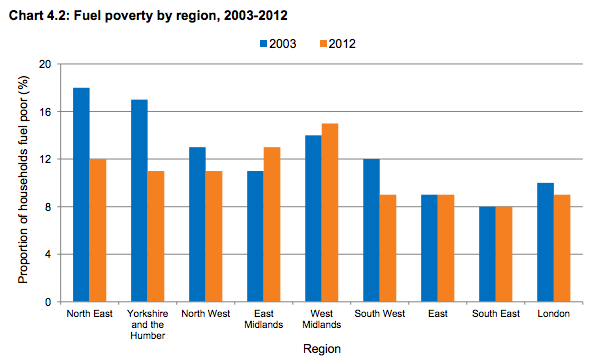 Though the proportion of fuel poor households in London is estimated to be lower than most other regions it can also be seen from graph above (copied from the report) that London has seen a much smaller drop across the decade in the number of fuel poor homes than other regions.
The key data breakdown for London is set out in a separate spreadsheet document – the ‘2012 sub-regional fuel poverty data: low income high costs indicator‘. The data includes a local authority breakdown of data and reports that Newham has the highest incidence of fuel poverty in London with close to 1 in 7 homes deemed to be fuel poor, followed by Harrow, Brent and Waltham Forest.
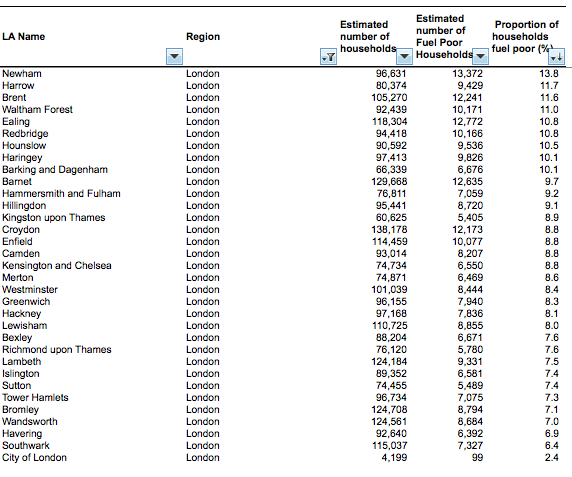
Table 3 of the dataset breaks down the local authority data further to ‘Lower Super Output Area’. Data on fuel poor households by London Parliamentary constituencies is also provided.
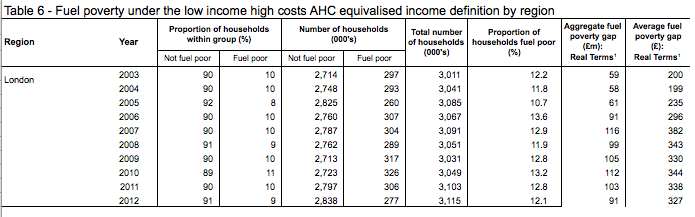
‘Fuel Poverty Trends 2003-12’ provides long term trends under the new Low Income High Costs (LIHC) indicator including a time series on number of households estimated to be fuel poor. The data for London is copied below and indicates that the proportion of London households in fuel poverty initially dipped in the early party of the century, but has increased again, hitting a maximum of 13.2% in 2010, before falling again slightly.
The ‘Fuel Poverty Detailed Tables‘ provide limited regional information, but provided data on fuel poverty by housing type, age of residents, age of dwelling, energy efficiency of dwelling, working status, tenure etc. An additional indicators note is also available here.